


An epidemic forecasting method
Table of contents
Article 1: A method to assess epidemics and make decisions in epidemic prevention and control
Article 2: An epidemic forecasting method
Article 3: Super-Spreading Waves
Website updating RT and other indicators operating since 21/09/2021 at onyx.vn/covid19/
Appendix: Weekly updates of the reproduction number and forecasts for some provinces and cities
An epidemic forecasting method
In this article we address the forecasting problem. Forecasting an epidemic is very hard because many different factors affect the epidemic (RT). It is roughly like the many different factors affecting GDP in economics. For example, the US CDC uses 26 models from different research groups, then combines them into one model (called an Ensemble) 1.
In the weekly update article, on the noon of 15/7/2021, since RT on 14/7 was 1.66 and Directive 16 applied to Ho Chi Minh City, we made the rough prediction that the total detected cases in the 4 days 17/7 to 18/7 would be at least 1.5 times the total detected cases in the 4 days 11/7 to 14/7 in Vietnam. However, RT did not keep falling but went sideways, and today's data show the above ratio is 1.7 (1.62 if RT is smoothed). In this article, we present a forecasting method different from the rough method.
First let us briefly discuss the rough method. If RT does not change in the future, the detected cases in the next n*T days are (when RT > 1)
(Cases in the latest T days) * RT * (RT n – 1)/( RT – 1).
This method is fast but not good for long periods (large n). For this reason, we present another method that allows forecasting further ahead. Based on our data — only the number of detected cases per day — and the incubation period property of COVID-19, we choose the simplest model, SEIR. We need to change some things when applying SEIR. The I compartment in SEIR will represent new cases detected within T days, and the E compartment represents undetected cases. Finally, we use multiple SEIR models over consecutive time intervals instead of a single SEIR model (or a SEIR with time-dependent parameters), to accommodate changes in the basic reproduction number. Let t0 be the starting time, T = 4 days before today (so today is t0 + 4). We choose t0 as the starting point because we need data to estimate parameters. The parameters used in the SEIR model are listed in the following table (8 parameters).
|
Parameter |
Value |
Reason |
|
N: Total population of Vietnam |
98 million |
Approximate |
|
E0: Undetected cases on day t0 |
Total detected cases from t0 +1 to t0 + 4 |
This is the period when most of these cases are detected |
|
I0: Detected cases within T days up to t0 |
Total detected cases from t0 – 3 to t0 |
|
|
Remove0: Cases unrelated to the transmission process |
1 million |
Does not affect the model much |
|
Gamma: Average incubation period |
4 days |
The average incubation period for the Delta variant is about 4 days |
|
Delta |
4 days |
T |
|
Re |
Estimate of RT on day t0 |
|
|
Beta |
Computed from the above parameters |
|
We need RT to predict future cases. Since predicting RT is hard, we present several scenarios in the following table.
|
Name |
RT |
Reason |
|
Scenario 1 |
RT is estimated by the smoothing curve (smooth spline with spar 0.6). |
One way to estimate RT. |
|
Scenario 2 |
RT is constant, estimated by today's value of the smoothing curve. |
The bad situation where our epidemic suppression is ineffective, only enough to maintain the current situation. |
|
Scenario 3 |
RT decreases linearly from today's estimate (1.62) to 1.1 within 3 weeks (a decrease of 0.025/day). |
Based on the lockdown situations in some places around the world, Bac Giang, and Bac Ninh, we consider this an optimistic outlook. |
Since the current estimate of RT is nearly constant, we drop scenario 1. The results of scenario 2 are shown in Figures 1 and 2. In Figure 1, we fail and only maintain RT at 1.62; the epidemic still peaks after about 3 months then declines. However, the detected cases at the peak will exceed 1 million cases/day. The red curve is new infections. New infections exceed detected cases in the early stage because many new infections have not been detected. This reverses in the future as the number of healthy, uninfected people decreases. Figure 2 is Figure 1 limited to 21 days. In just the next 13 days, the total detected cases already reach nearly 100 thousand (not counting undetected cases). The total detected cases in the next 21 days is 219,771.
The results of scenario 3 are in Figure 3. Although we consider this an optimistic scenario, in just the next 17 days the total detected cases already reach about 100 thousand (not counting undetected cases). The total detected cases in the next 21 days is 165,353.
Details on using compartmental models in general and SEIR in particular for forecasting can be found in the slides attached to the previous article and the references cited therein.
References
1. COVID-19 Forecasts: Cases | CDC. Available at: https://www.cdc.gov/coronavirus/2019-ncov/science/forecasting/forecasts-cases.html. (Accessed: 18th July 2021)
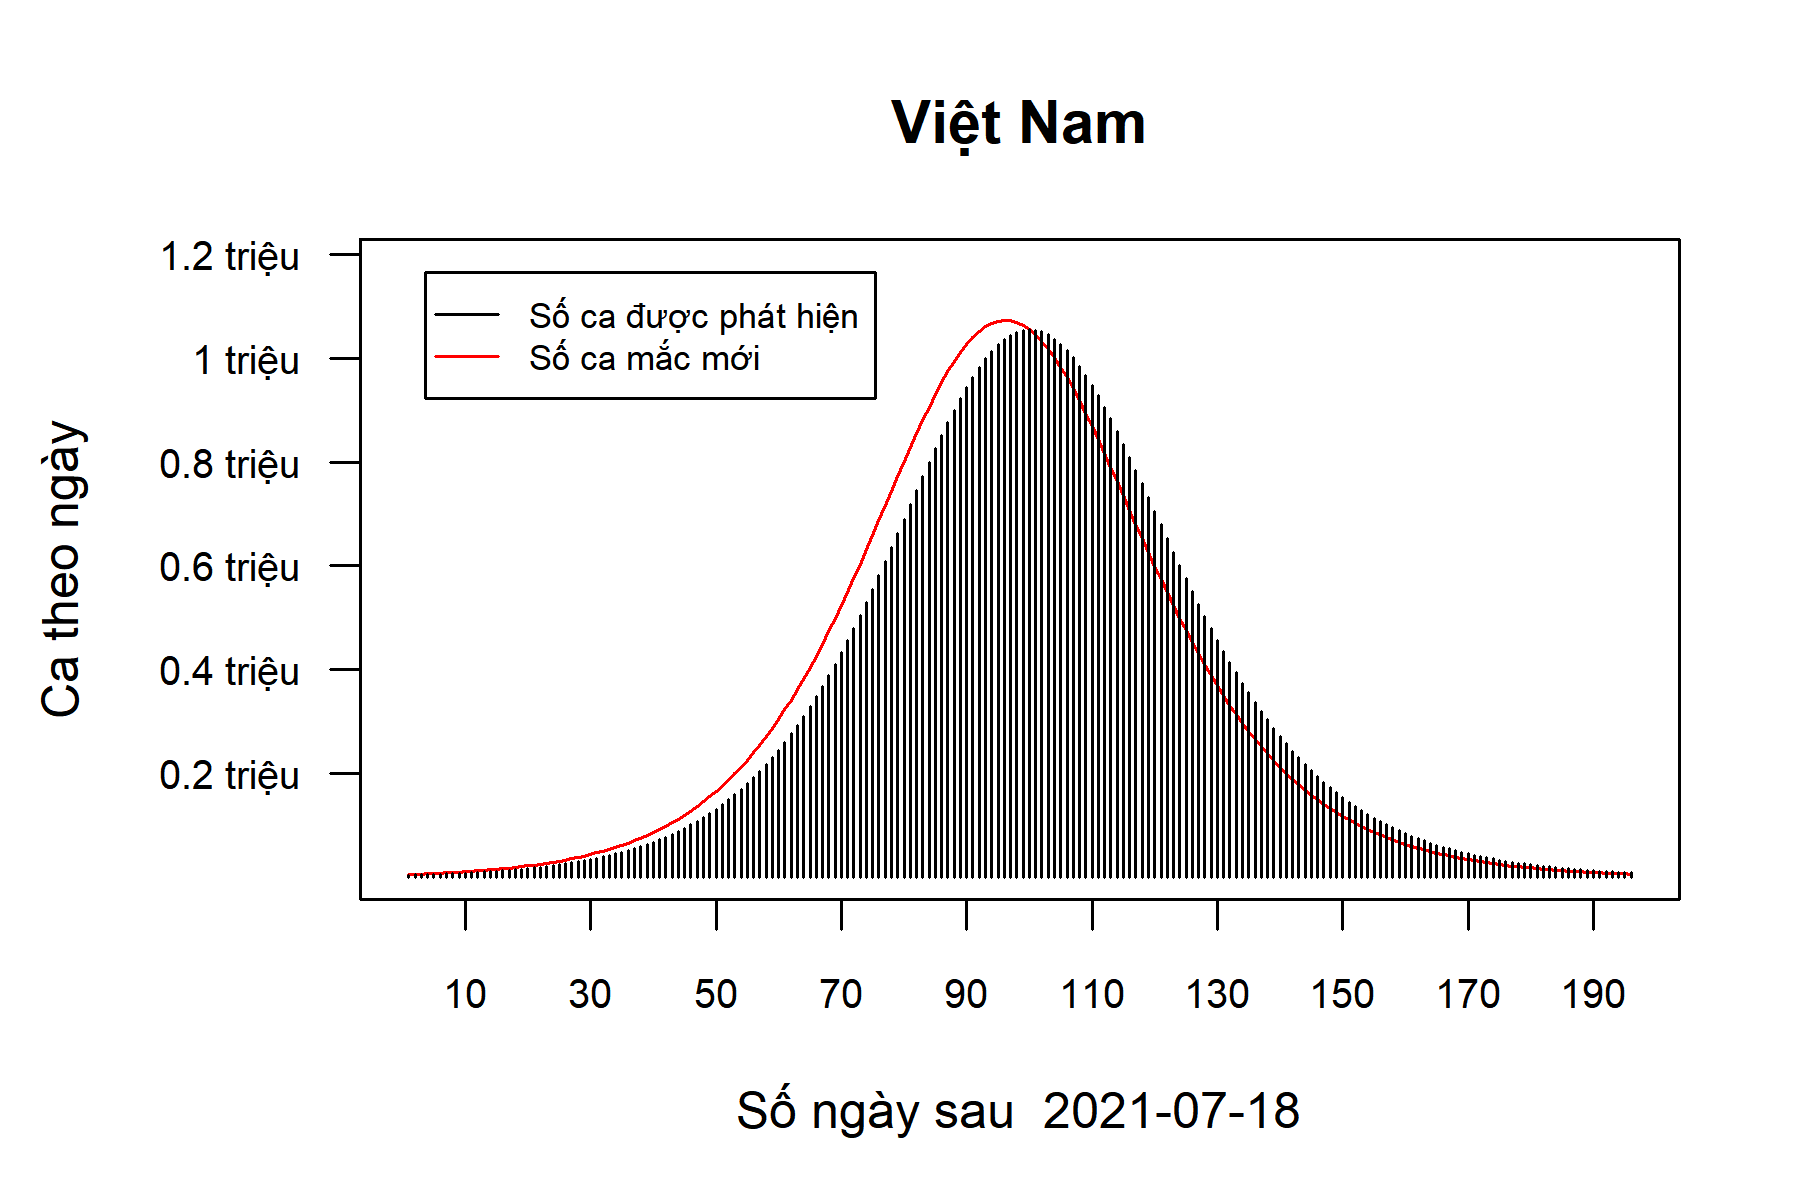
Figure 1. Scenario 2 with RT = 1.62.
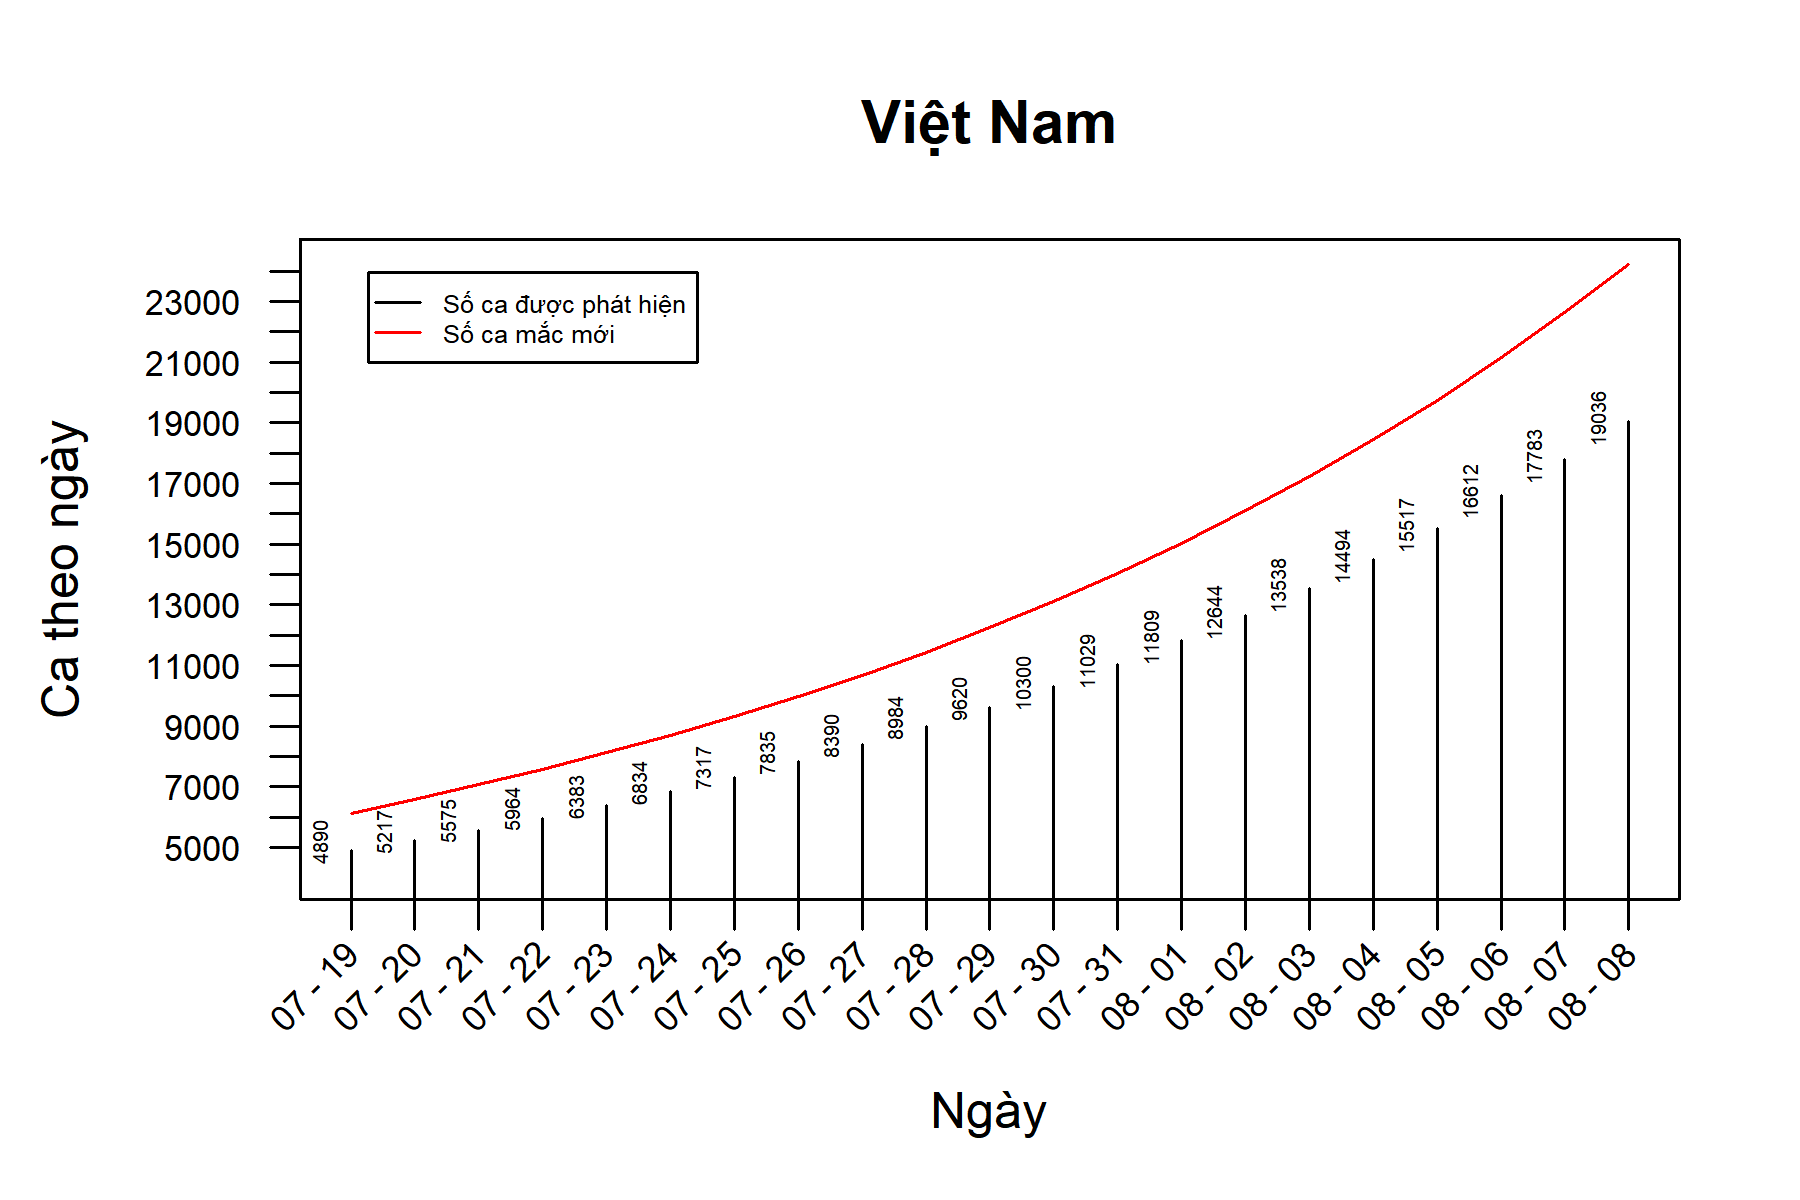
Figure 2. Scenario 2 with RT = 1.62 in the first 21 days.
(Total detected cases in the next 21 days is 219,771.)
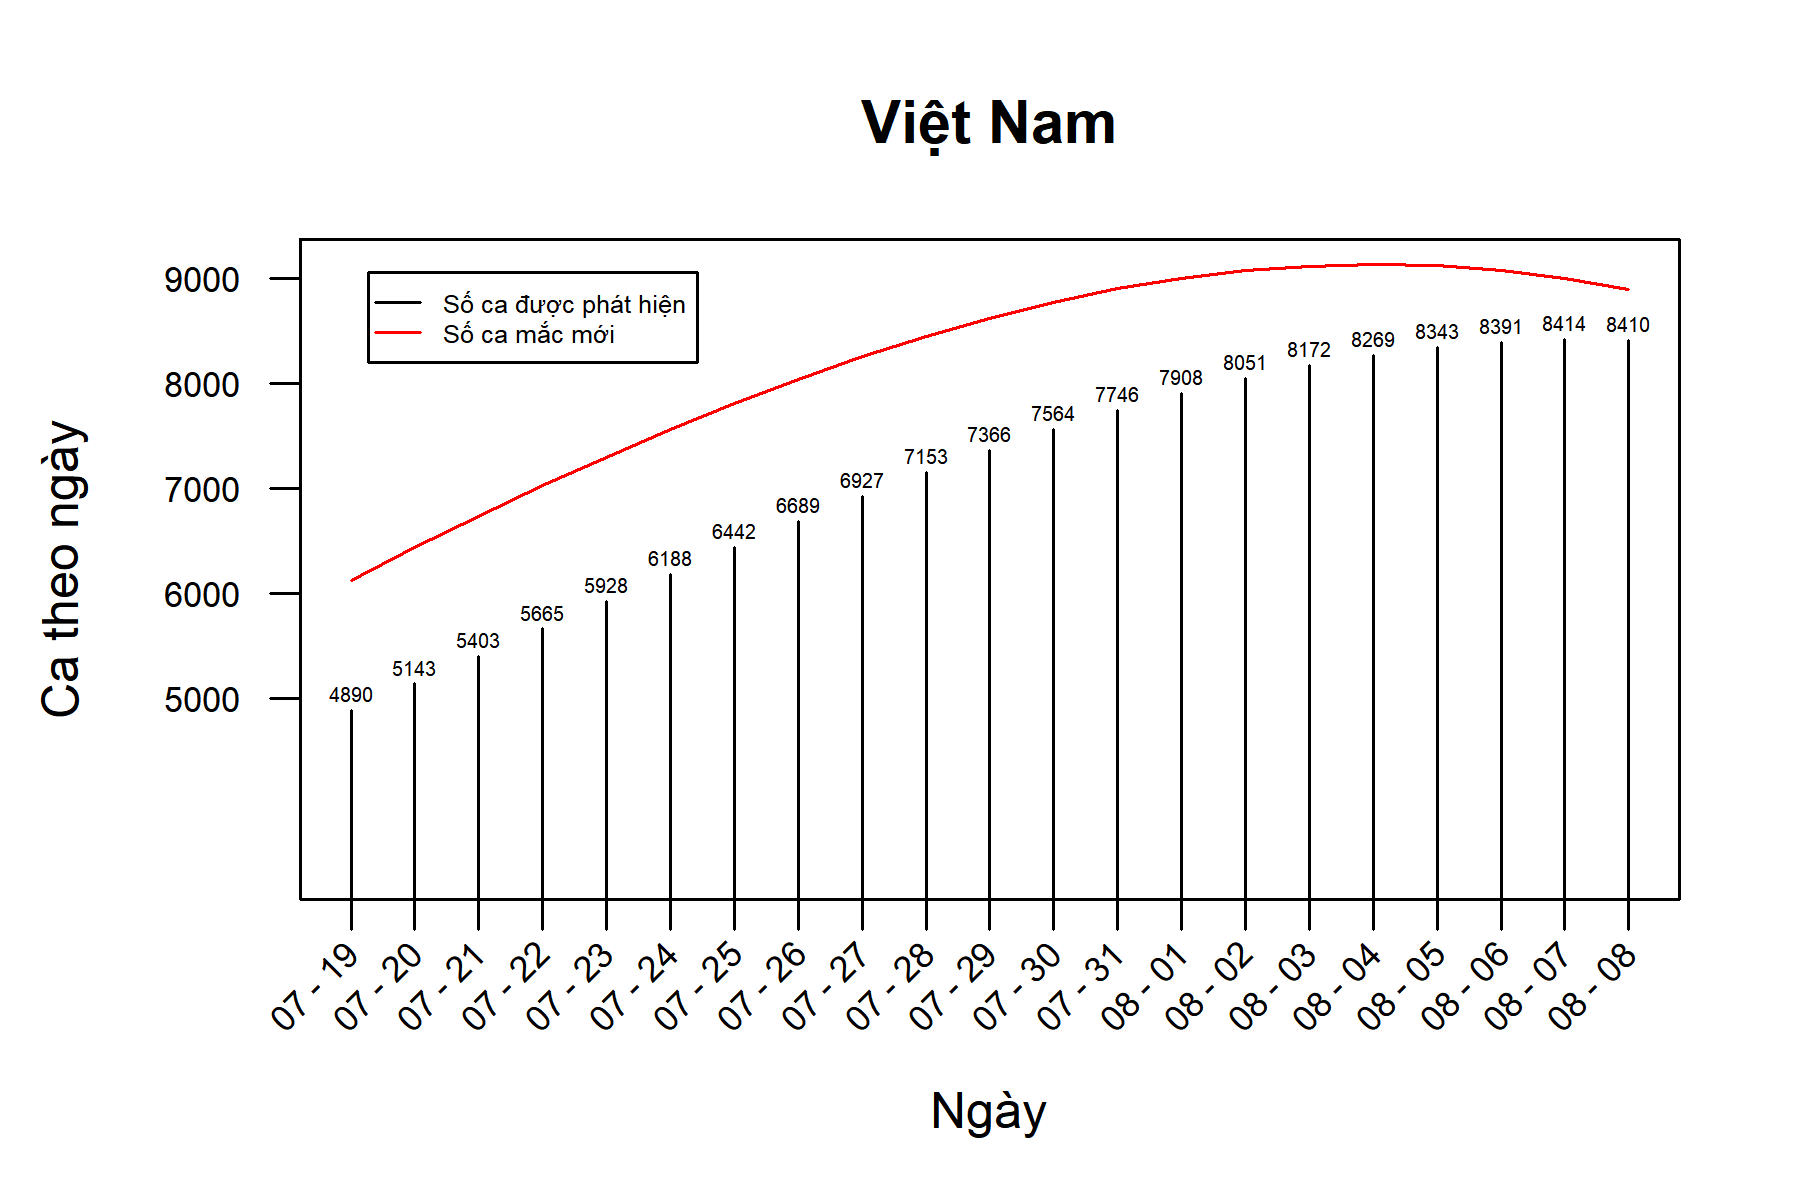
Figure 3. Scenario 3 with RT decreasing linearly from 1.62 to 1.1 over 21 days (a decrease of 0.025/day)
(After 21 days, nearly catching up with the epidemic at 165k cases — this is the optimistic outlook.)