


Weekly updates of the reproduction number and forecasts for Vietnam, some provinces, and cities
Table of contents
Article 1: A method to assess epidemics and make decisions in epidemic prevention and control
Article 2: An epidemic forecasting method
Article 3: Super-Spreading Waves
Website updating RT and other indicators operating since 21/09 at onyx.vn/covid19/
Appendix: Weekly updates of the reproduction number and forecasts for Vietnam, some provinces, and cities
- Website updating RT and other indicators operating since 21/09 at onyx.vn/covid19/
Weekly updates of the reproduction number and forecasts for Vietnam, some provinces, and cities
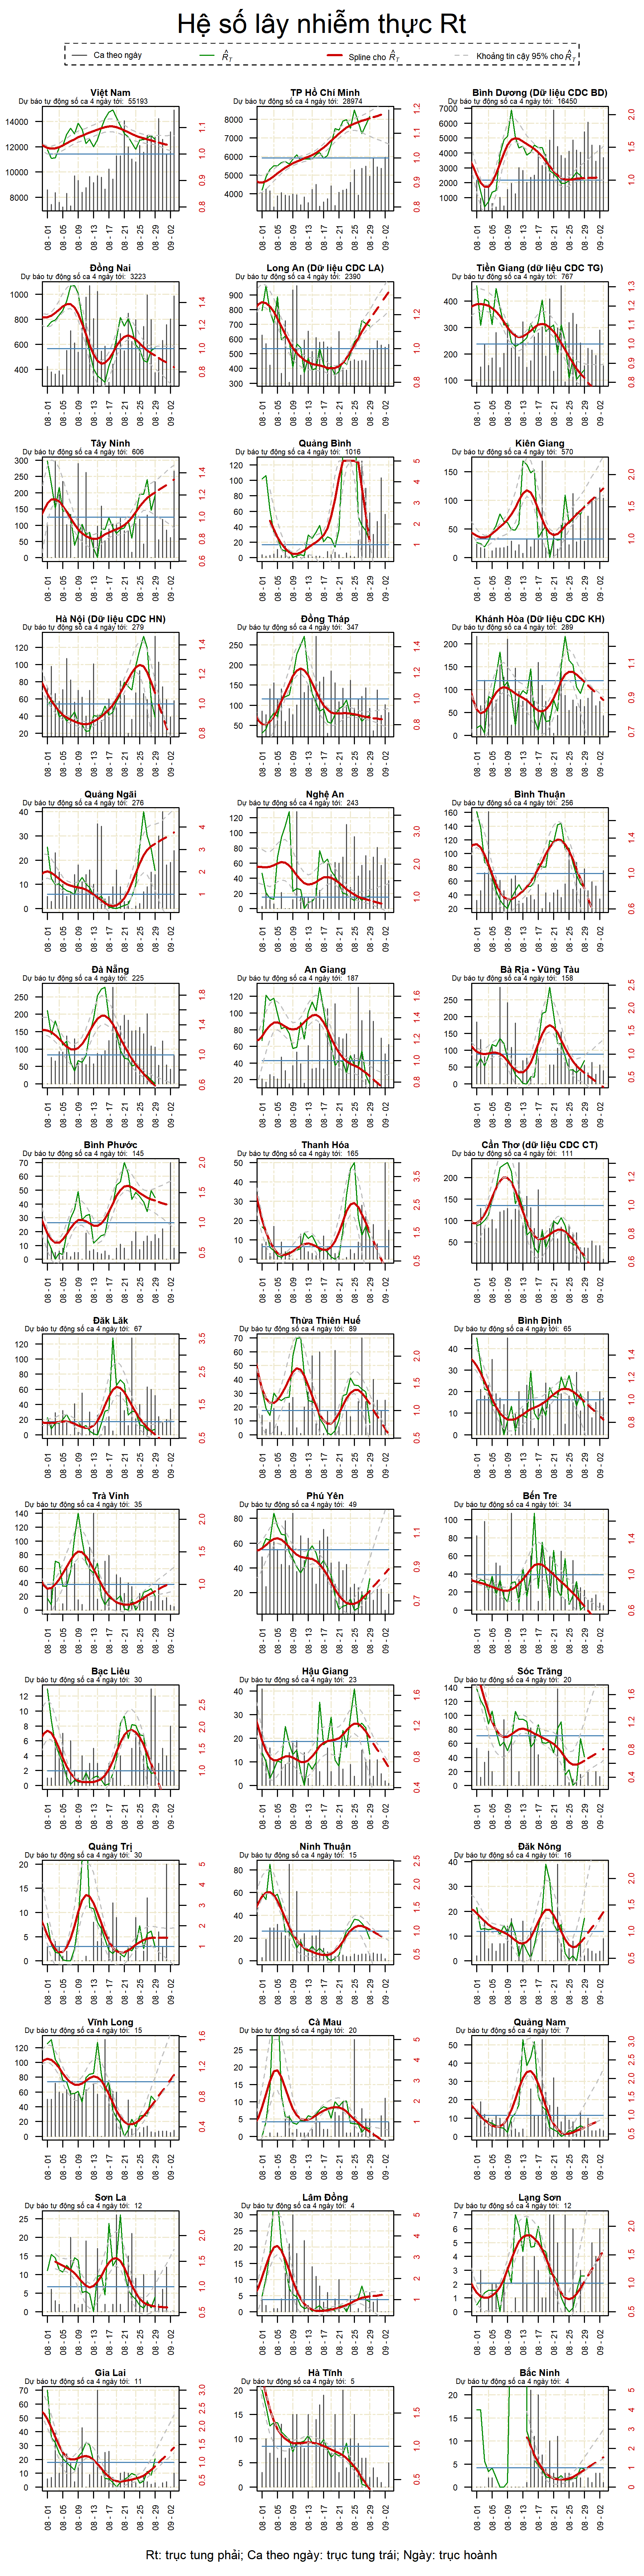
The method for computing the effective reproduction number and its meaning were presented in a previous article. We restate the following table on the meaning of the effective reproduction number estimate. (In the charts, the green curve is RT. It fully captures the local properties. The red curve smooths the green curve to show the global trend of RT. For analysis, we need to observe both curves because they complement each other. We must also watch daily case numbers, because when cases exceed contact tracing capacity, the situation deteriorates quickly.)
|
RT(t) |
Meaning |
|
RT(t) approximates R0 |
We are not intervening |
|
R0 > RT(t) > 1 but RT(t) shows no clear downward trend toward below 1 |
Our epidemic suppression is not good enough |
|
R0 > RT(t) > 1 and RT(t) clearly trends down toward below 1 over many days |
Epidemic suppression is progressing well |
|
1 > RT(t) |
We will have successfully suppressed the epidemic if we keep it up until no cases remain |
http://onyx.vn/covid/CovidVietnam.Report.21903.pdf
http://onyx.vn/covid/CovidVietnam.Report.21907.pdf
Assessment of the COVID-19 situation in Hanoi (HN), updated Rt for the provinces
The main questions are: Can HN control the epidemic? When will HN suppress it? We also update Rt for the provinces. From next month, we will update Rt daily for the provinces.
Observation: Contrary to the downward trend forecast for HN's Rt two weeks ago, HN's Rt has risen continuously since 12/08 and crossed above 1. For deeper analysis, we compute Rt for the districts. District-level analysis approximates outbreak-cluster analysis (we do not have information on clusters). Data are from the Hanoi CDC [1]. The results are in Figures 1, 1a, and 2.
Analysis: The rise in HN's Rt has 3 causes. First, when HN began mass testing on 10/08, more samples were collected than before, causing Rt to be over-estimated [2]. Second, HN avoided an SS caused by pre-lockdown market shopping, but suffered an SS caused by travel permits, making cases rise on 17-20/8 (more detail below). Third, on 23/08, HN detected a new outbreak cluster [3]. This cause is the most important. Had no new cluster been found, Rt would have soon returned to its old trajectory from before 10/8. Among the districts, only Thanh Xuan's Rt is above 1 and still rising.

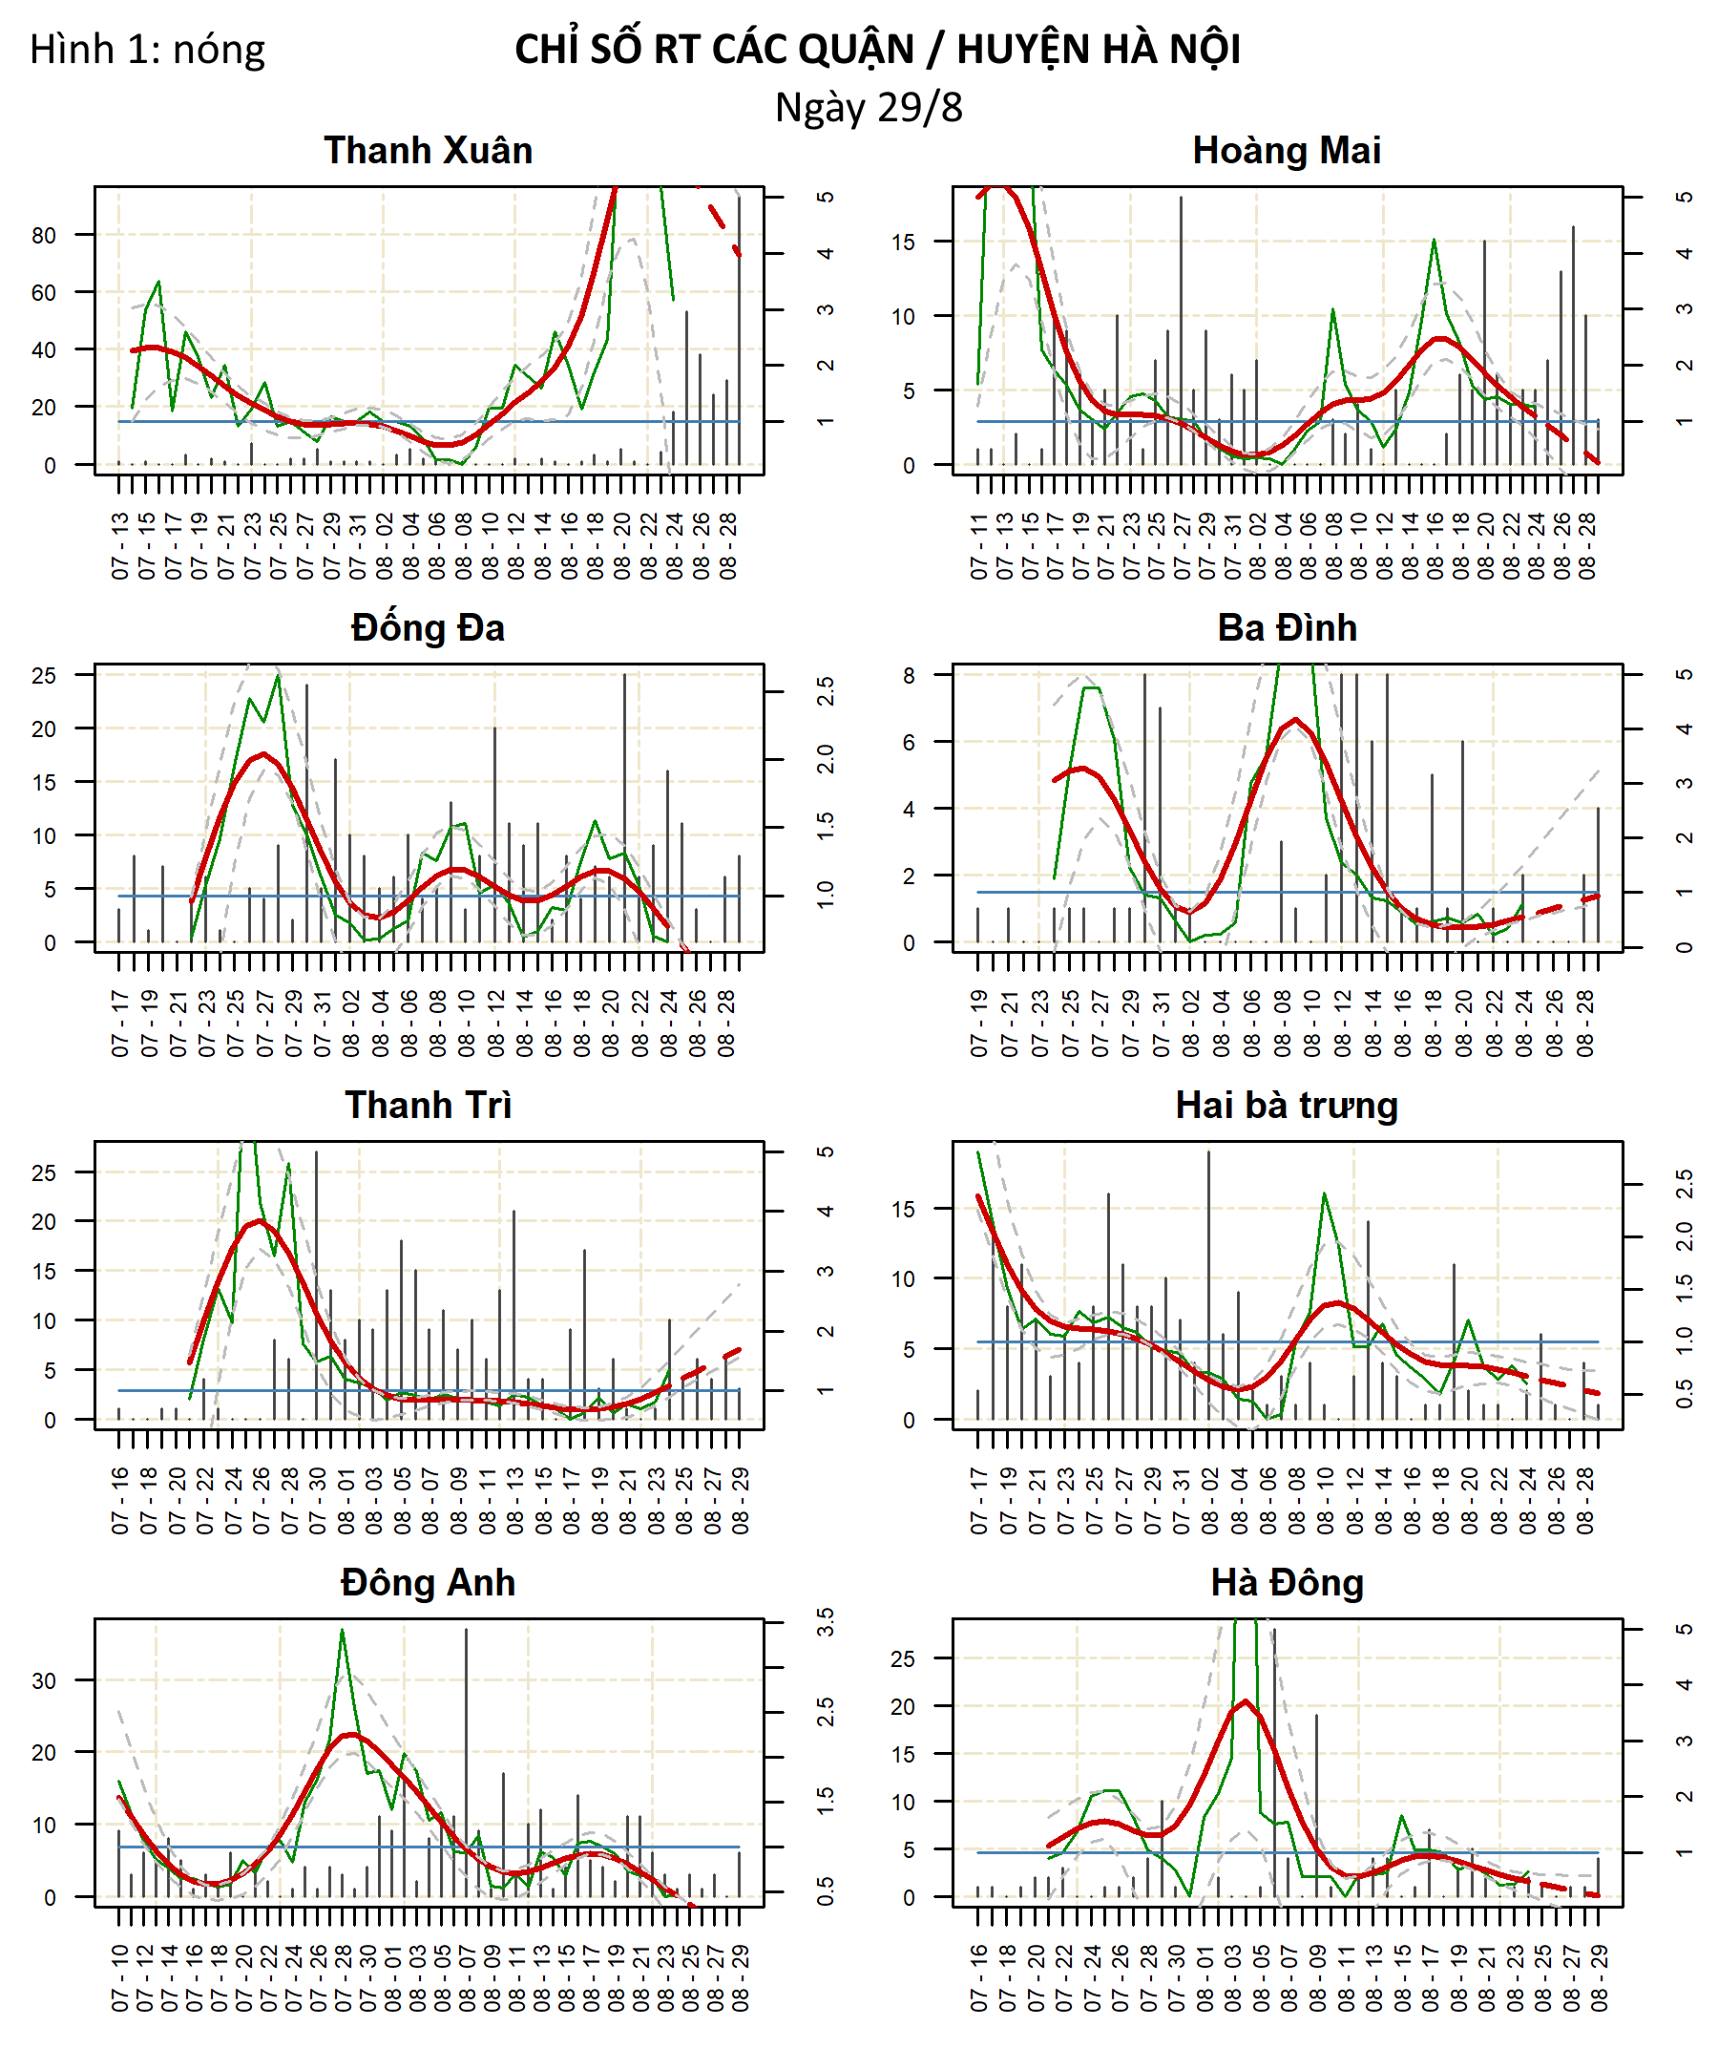
Figure 1: Hot districts, full data from the start of the outbreak
We hypothesize that the congestion caused by travel permits in HN on 9/8 led to new outbreak clusters appearing in Ba Dinh, Dong Da, Thach That, Ha Dong, and Hoang Mai districts after that event [4]. The evidence is that case numbers spiked about 8-10 days later in those districts (around 17-20/08).
The new cluster in Thanh Xuan is quite serious. HN discovered a fairly large Thanh Xuan cluster despite implementing Directive 16, showing that some residential areas still have quite high local Rt.
For the first main question: HN has not yet controlled the epidemic. Whether HN can control it depends on whether the Thanh Xuan cluster can be controlled. HN's and Thanh Xuan's Rt are above 1.
Now let us discuss the second main question. The current issue is that HN cannot screen the whole city, so the Thanh Xuan cluster was only detected because patients went to see doctors [5]. As we analyzed in Part 1, by the time patients see a doctor, the cluster may already be quite large. Deputy Director of the Hanoi CDC Khổng Minh Tuấn said "Thanh Xuan Trung was not in a risk area and was not subject to mass testing because it had no epidemic-related factors. That is where the difficulty lies" [6].
We do not have a complete answer to the second question because of the Delta variant's strong spread. We try to answer as specifically as possible. Since testing all of HN is impossible, we return to the cluster detection problem in Part 1. To recall Part 1: with the Delta variant, in a normal society (R0=5), if we assume the probability of detecting a case is p = 10%, and the time to detection is at most t = 7 days, then we detect the cluster with a probability of 95% within 15 days (when the cluster already has 156 - 781 cases). So the task is to increase p and reduce t when mass testing is impossible. Under Directive 16, Rt falls below 1 instead of 5, so the 15-day criterion above no longer holds. The 15-day criterion only holds for Rt = 5, which may have been the case in Thanh Xuan where Rt was not low at all under Directive 16.
So if within 15 consecutive days HN detects no new community cases (i.e., no new cluster), HN has been very successful. To be sure HN has suppressed the epidemic, we must observe zero cases for at least 14 days. The situation in Bac Ninh and Bac Giang shows this is hard if surrounding localities still have the epidemic. We will write a new article going deeper into this issue (asymptomatic cases, incomplete testing, detection delay due to incubation and testing, etc.). The difficulty is that under Directive 16, Rt drops low and the epidemic may be stamped out, but it can persist at a very small level. When society reopens, Rt rises, and the epidemic flares up again when a super-spreading opportunity arises.
For the conclusion, we have three recommendations:
Recommendation 1: Keep good control of the clusters in Thanh Xuan, Hoang Mai, Thanh Tri, Nam Tu Liem, Thach That, and Ba Dinh, especially the Thanh Xuan cluster.
Recommendation 2: When mass testing is impossible, test high-risk groups (to increase p and reduce t). Of course, more testing means earlier detection, but higher cost. Balancing testing cost, vaccine cost, lockdown cost, and testing capacity is a problem we need to calculate more carefully later. Besides cost, in terms of feasibility, vaccines are hard to buy, while test kits are easier. For now, we need to strengthen communication and urge people with cough or fever symptoms to see a doctor. Since "cough and fever" is too vague and people may not understand, we need to publicize symptoms more specifically so people understand the risk clearly and raise their awareness. We must ask people why they do not get tested even though it is free. When I asked, my friend replied that he smokes, so he coughs every day; surely he cannot get tested daily. Communication needs to be more active, clear, specific, and understandable. First, community groups must be fully aware, then the public. We are not experts on groups with specific symptoms. For example, Assoc. Prof. Nguyễn Tiến Huy in Japan has, for over a year, presented the following group of specific symptoms [7]:
(1) Fever for 4 days, ruling out flu (with rapid test), pharyngitis (fairly easy for a doctor to diagnose)
(2) Fever for 2 days with underlying conditions or age >65
(3) Pneumonia regardless of cause
(4) Fever or cough together with another person in the family, relatives, colleagues, or close contacts within an 11-day period also showing fever or cough.
(5) Fever for 2 days among high-risk workers such as: customs officers, salespeople, drivers, healthcare workers, tourism workers, shippers.
Recommendation 3: Locking down for too long is infeasible. In the long term, consider lowering to Directive 15 for districts with no community cases for 15 days (no new clusters for 15 days). The condition is to urge people to get tested when they have the specific symptoms above. In Dan Phuong, for example, symptoms were clear on 18/8, but it was only detected on 30/8 [8]. Or in the Thanh Xuan cluster, many F0s had symptoms earlier, but the cluster was detected only much later.
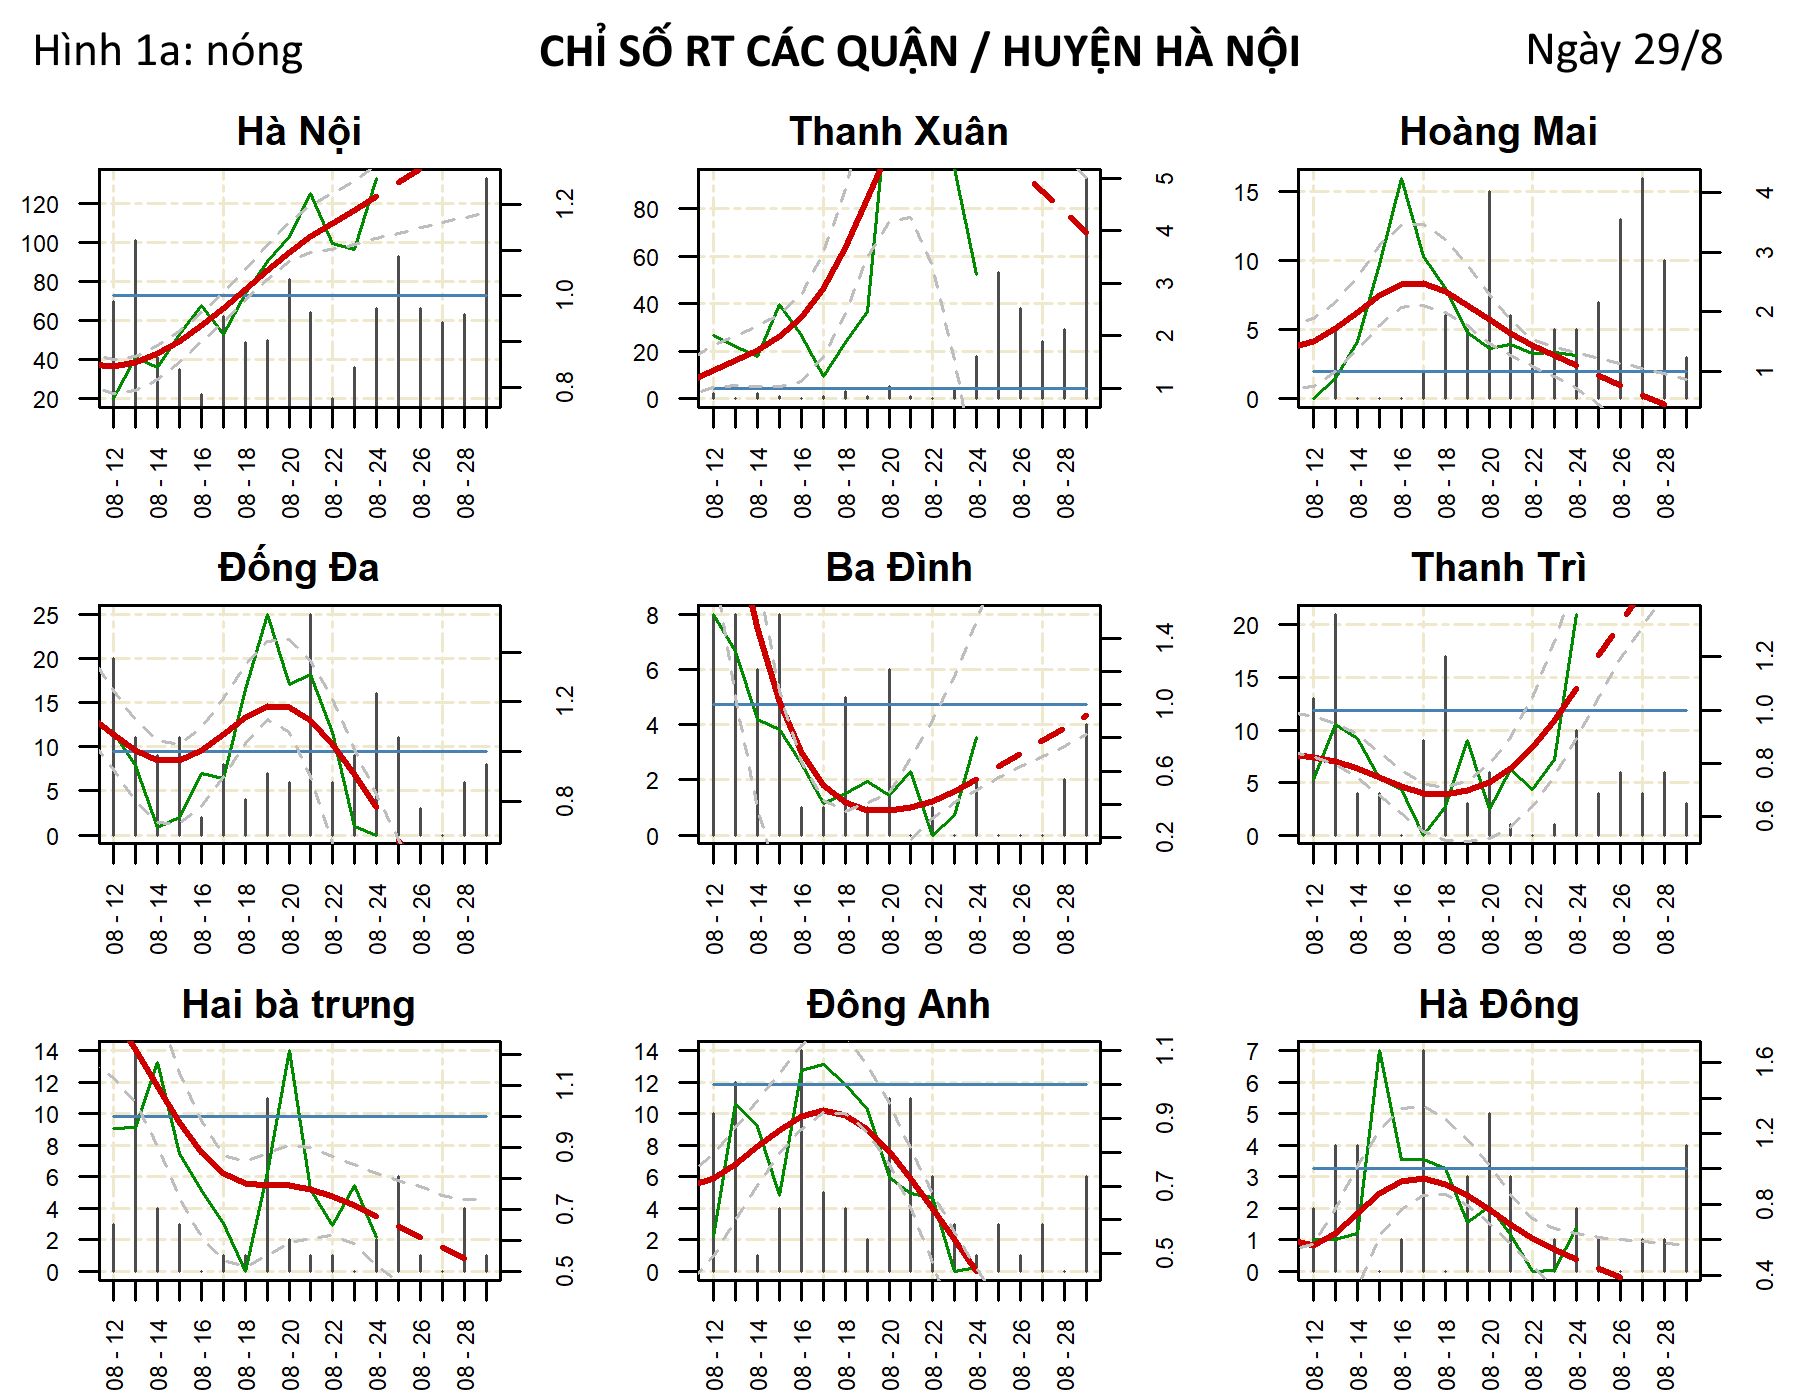
Figure 1a: Hanoi and hot spots over 2 weeks.
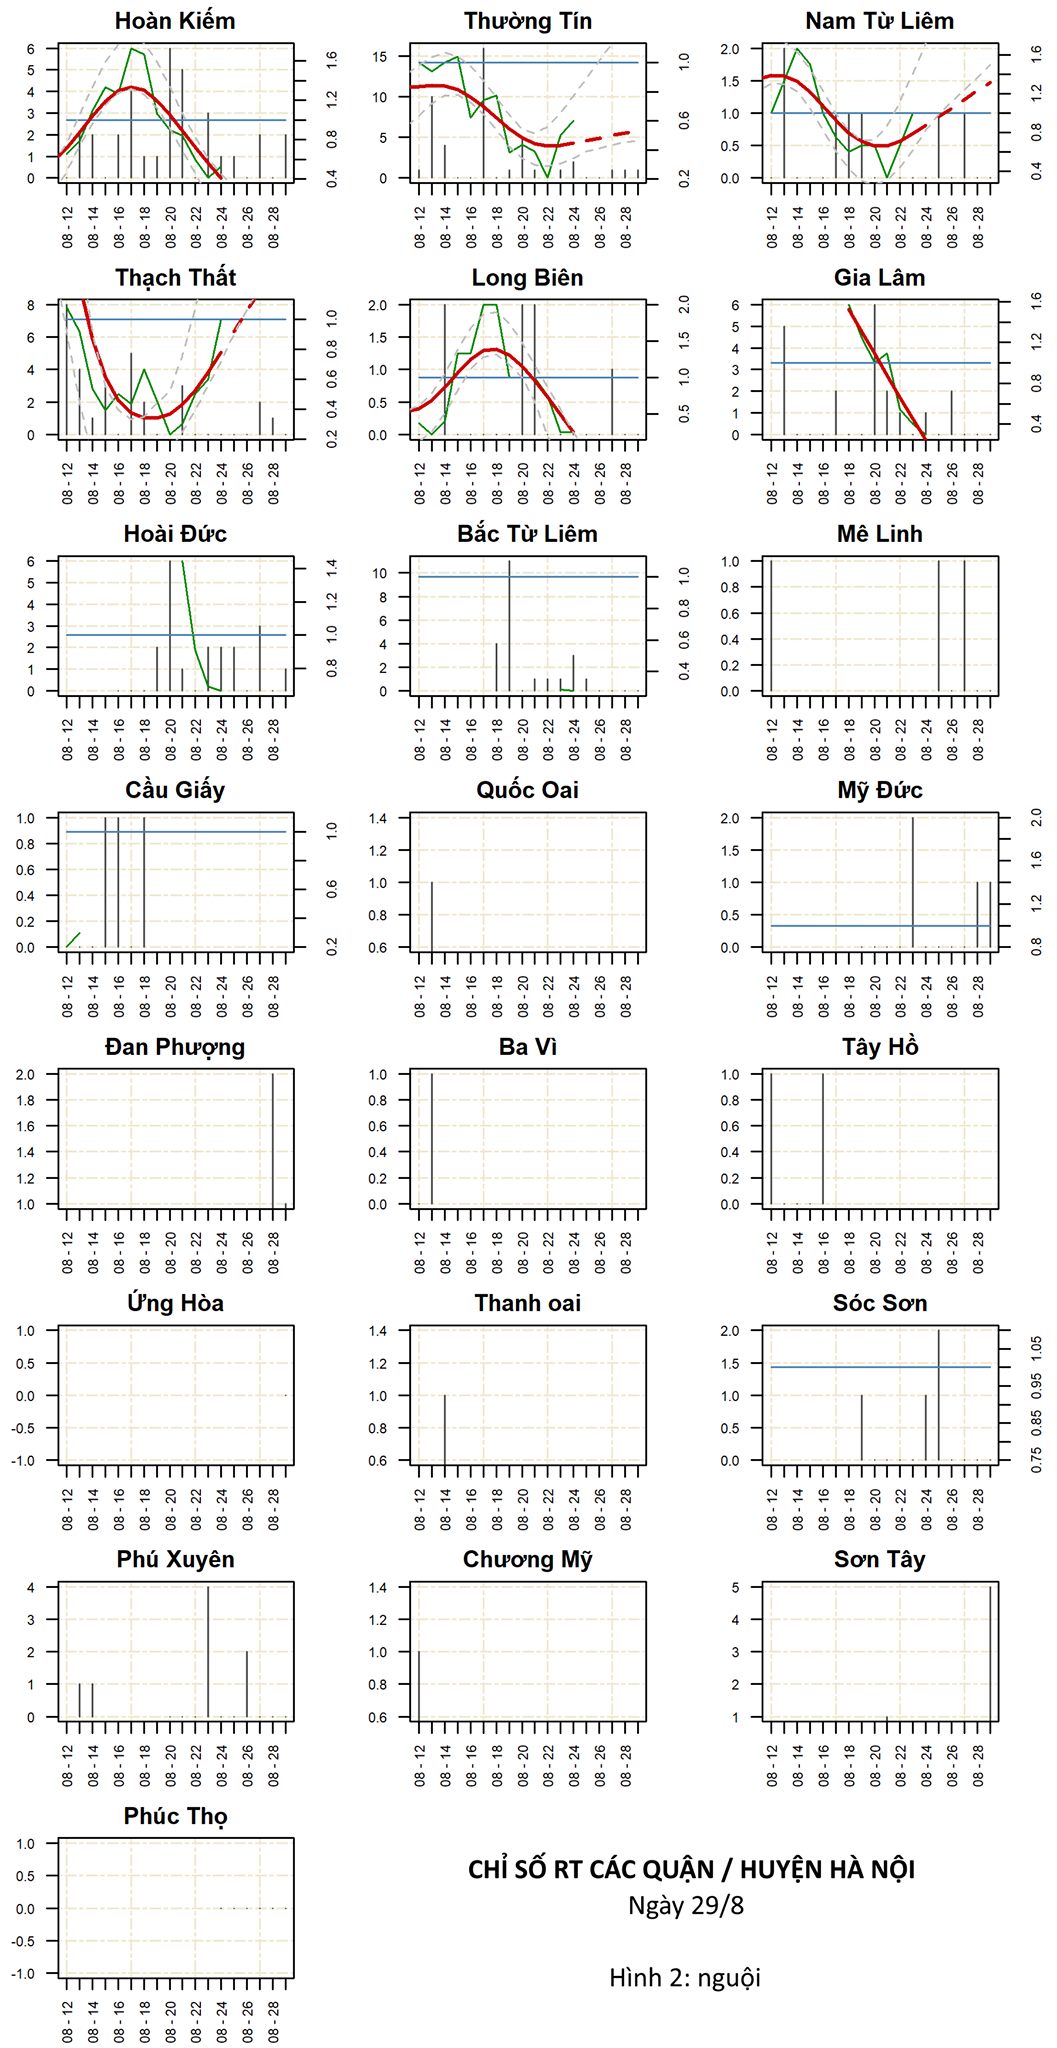
Figure 2: Other districts in Hanoi
References:
[1] http://hanoicdc.gov.vn/1340n/cap-nhat-tinh-hinh-dich-benh-covid19-tai-thanh-pho-ha-noi.html
[2] http://baochinhphu.vn/Hoat-dong-dia-phuong/Ha-Noi-se-lay-mau-xet-nghiem-cho-300000-nguoi-tu-10178/441788.vgp
[3] https://ncov.moh.gov.vn/vi/web/guest/-/6847426-6948
[4] https://vov.vn/xa-hoi/tin-24h/xyz-881052.vov
[5] https://ncov.moh.gov.vn/vi/web/guest/-/6847426-6948
[7] https://www.facebook.com/nguyentien.huy.319
[8] https://thanhnien.vn/thoi-su/ha-noi-khan-cap-phong-toa-xa-tan-lap-o-hdan-phuong-vi-xuat-hien-ca-covid-19-1441218.html
Below is Rt for the provinces on 29/08/2021.
Update 15/08/2021
In the article on Super-Spreading Waves, we define the epidemic peak as when the red RT curve crosses from above 1 to below 1. The bad news is that Vietnam (VN) is heading toward a second epidemic peak created by Binh Duong (BD), Dong Nai (DN), and Long An (LA). The second peak is even higher than the first peak created by Ho Chi Minh City (HCMC). Intuitively, it looks like two bells placed side by side, with the second taller than the first. The good news is that we can completely suppress the Delta variant if we concentrate our currently limited resources in the right places. We will forecast VN, Hanoi, and hot spots such as HCMC, BD, DN, and LA. Can Tho and Tien Giang provinces also deserve attention but are less critical.
Before the analysis and forecasts, let us recall the key events:
- Directive 16 (D16) began in HCMC on 09/07 (5 and a half weeks ago) when HCMC already had about 1000 cases/day.
- D16 in BD, DN, and LA began on 20/7 (a week and a half after HCMC) when those provinces had about 600, 150, and 46 cases/day, respectively.
When estimating RT, we observe:
1. The speed of RT reaching 1 (epidemic peak) since D16 was applied:
- HCMC went in the right direction with effort, so RT,HCM impressively reached 1 in under 3 weeks (19 days).
- LA acted quickly while cases were low, so RT,LA also reached 1 spectacularly within 3 weeks.
- RT for BD and DN declined but plateaued around 1.2 even though both provinces had spent 4 weeks implementing D16.
2. The speed of RT declining after falling below 1:
- RT,HCM has declined very slowly and has hovered, even returning to level 1, for 2 and a half weeks. Normally this takes at most 2 weeks.
For accurate forecasts, we need to understand the causes of the above phenomena.
- Explaining why RT,DN reaches 1 slowly: The purpose of D16 is to reduce contact among people and screen F0s. D16 is not everything; it depends on contact tracing and testing capacity and the degree of implementation (which depends on economic conditions, the authorities, and/or the people). There have been many studies of the link between Google mobility and RT 1,2. To measure the degree of D16 implementation, we take the average of these 4 mobility trend (MT) quantities in Google mobility: retail and recreation, grocery and pharmacy, workplaces, and transit stations. We have not used a model; however, we observe that the average MT must drop to about 20 – 25% of normal movement for RT to fall to 1 in the southern provinces. We see that DN's MT declined linearly rather than dropping suddenly like BD and LA (Figure 1). DN's MT reached 25% on 02/08, 5 – 7 days slower than BD and LA. LA's MT has just reached 27%, but LA has the advantage of a small case count when D16 began. We think RT,DN will reach 1 at least 1 week slower than LA.
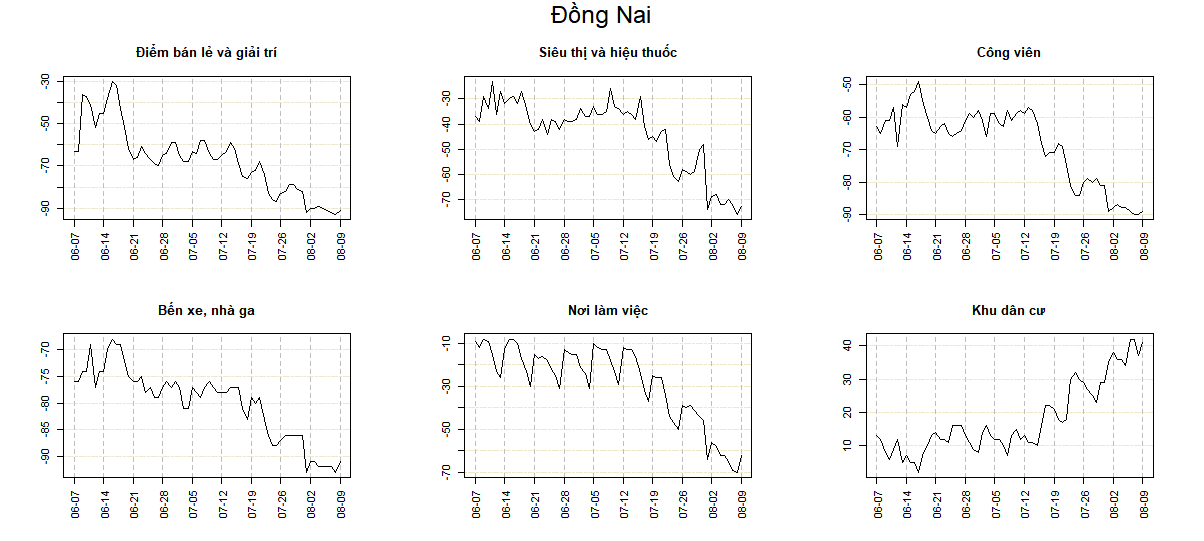
Figure 1. Mobility trends in DN
- Why RT,BD reaches 1 slowly: We are not sure of the cause. One hypothesis is that because BD's population is quite large, BD's MT was not very low before D16, and it has only now reached 24%. We recommend BD try to lower MT further to 20% like HCMC. Delhi, India's MT even reached 18% within 4 days.
- Why RT,HCM has plateaued for so long: We are not sure of the cause. One hypothesis is that HCMC has concentrated resources on treating F0s, so cases rose again. The evidence is that community cases in HCMC have increased recently (Figure 2). First, we think reducing daily cases is the main way to reduce the medical burden. Second, observing places like Delhi, India, we see the Delta variant makes cases rise high but also fall fast compared with other strains (sharp peak). We therefore hope HCMC will keep concentrating its (limited) resources on contact tracing and testing.
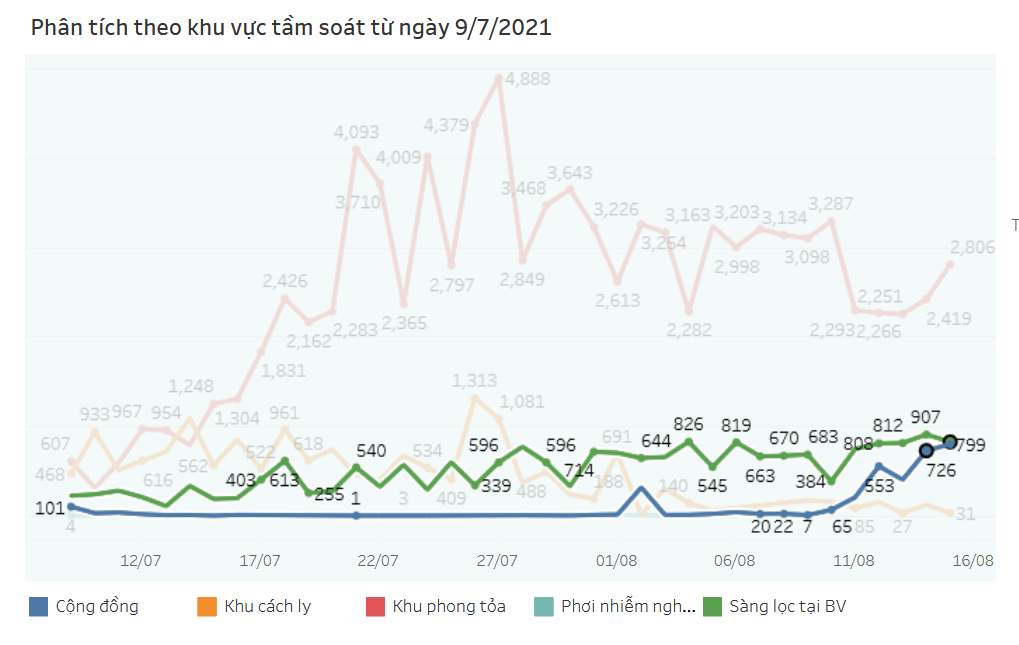
Figure 2: Community cases in HCMC have increased recently
We look at Delhi, India, as a history lesson. They locked down on 23/03, and their MT dropped to 18% in just 4 days (Figure 3). They shut nearly everything immediately, then gradually raised activity. Even as they gradually raised it from 18%, they kept it at or below 20% until RT fell below 1, then relaxed beyond 20%. Grocery and pharmacy — the most essential — operated at very low levels for the first 2 weeks, then gradually increased. Retail and recreation were almost completely closed.
Because we are uncertain about the provinces' strategies and about policies changing after 2 more weeks, we only forecast for the next 2 weeks. We reiterate our recommendation that provinces apply D16+ and tighten further, because we still have a chance to push back Delta. Reducing MT by another 5% is hard. We hope the provinces will strive to achieve this while maintaining resources for contact tracing, testing, and zoning.
Note: We adjusted the RT calculation to remove the 7-day cycle and reduce noise, so the green RT curve is smoother than before 3.
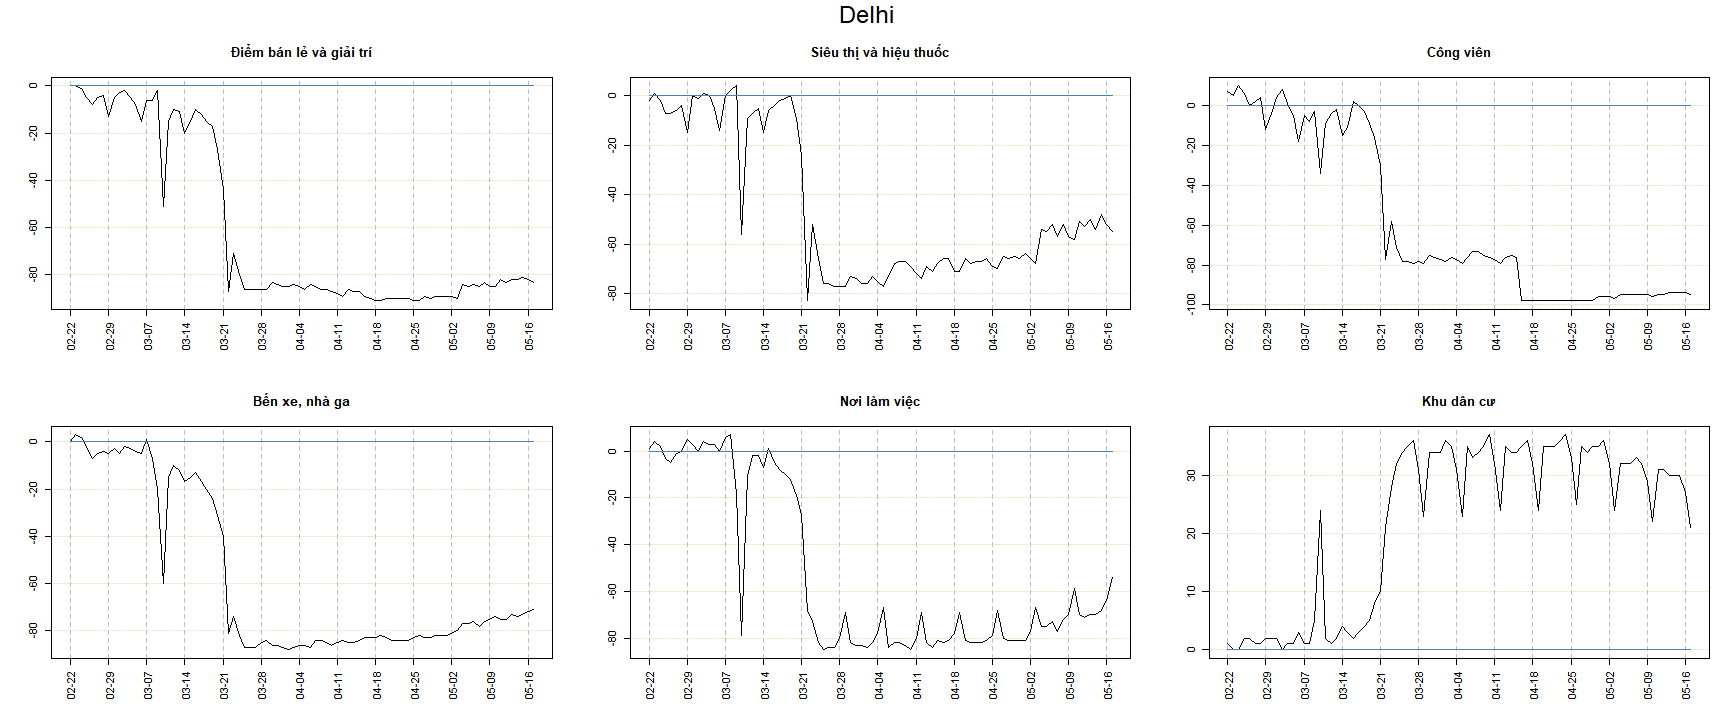
Figure 3. Mobility trends in Delhi, India.
Figure 4. 2-week forecasts for VN and some provinces/cities.
Figure 5. Situation assessment for VN and the provinces/cities.
References:
1. Nouvellet, P. et al. Reduction in mobility and COVID-19 transmission. Nat. Commun. 12, 1090 (2021).
2. Arenas, A. et al. Derivation of the effective reproduction number ℛ for COVID-19 in relation to mobility restrictions and confinement. medRxiv 2020.04.06.20054320 (2020). doi:10.1101/2020.04.06.20054320
3. Koch, R. Erläuterung der Schätzung der zeitlich variierenden Reproduktionszahl R.
Update 25/07/2021
Ever since COVID-19 first appeared, there has been a saying: "Only when new cases decline for 14 consecutive days have we controlled the epidemic." Since the serial interval has not changed much, that saying still holds now. Applied to RT, it is close to "RT < 1 for 14 consecutive days is when we begin to control the epidemic".
Data correction: Tuoi Tre newspaper reported on 20/07 that Long An's data were entered into the database late (All dates mentioned in the article are for 2021.) According to the Ministry of Health, we evenly distributed Long An's 1,288 cases of 24/07 over 9 days from 14-22/7. This led to Vietnam's (VN) data being similarly corrected (On 24/07, from 9,225 cases down to 7,937.) Today's data for Long An is 0 cases, so we temporarily corrected Long An and VN upward by 700 cases for today (25/07).
Analysis:
1. Overall, the data of 19-22/07 followed the optimistic trajectory, but the data of 23-25/07 rose above the bad trajectory mentioned on 18/07. However, RT is trending downward for VN and Ho Chi Minh City (HCM). Hanoi, Ba Ria – Vung Tau, Binh Duong, Dong Nai, HCMC, Long An, Tay Ninh, and Tien Giang are at very high risk (large daily case counts and RT > 1 for many days). Vinh Phuc, Binh Dinh, Ninh Thuan, Quang Ngai, and Tra Vinh are at lower risk but need close attention.
2. In VN's data, the case count on 18/07 was abnormally high. There could be many reasons, such as tests piled into one day, or people gathering on one occasion, etc. We present a hypothesis with evidence. Looking at the 14-day chart in Figure 3, this increase was caused by HCMC. We hypothesize that the rise was caused by people gathering to stockpile goods right before HCMC implemented Directive 16 at 0h on 09/07. This hypothesis is supported by three pieces of evidence. First, Google Mobility shows a sudden spike in supermarket and pharmacy visits exactly on 08/07 in HCMC (the same happened in Dong Nai and Long An).
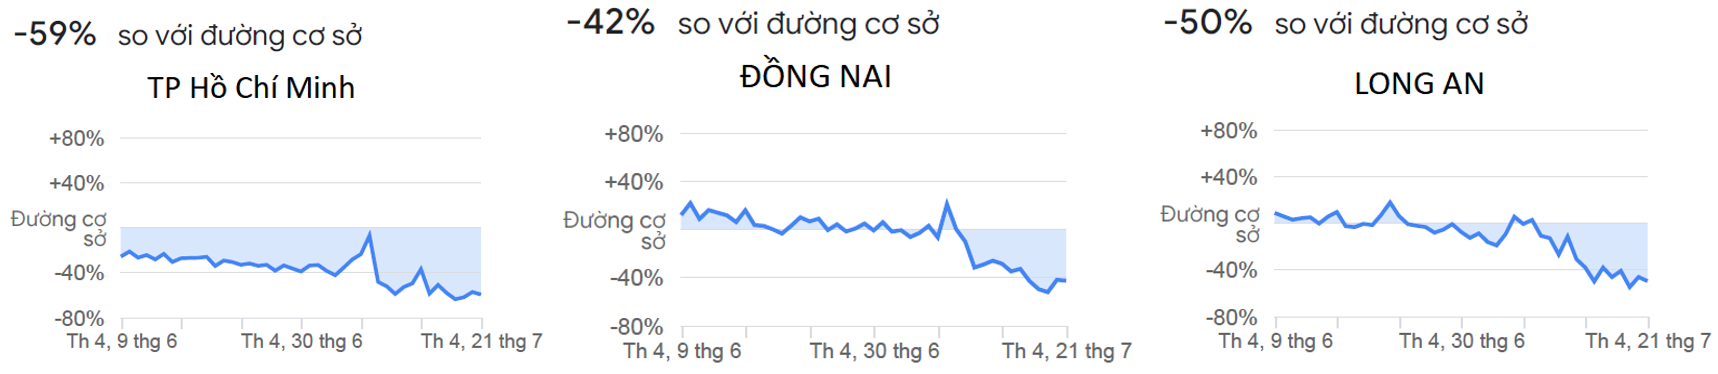
Figure 0a. Google mobility - Supermarkets and pharmacies for HCMC, Dong Nai, and Long An
Second, the RT for VN and HCMC rose on 13-14/07, i.e., 5-6 days after 08/07. We know that RT,symptom onset (computed at symptom onset) lags RT,infection (computed at infection) by about 4-5 days because the average incubation period is 4-5 days. RT,detection (computed at case detection) is what we compute and usually lags RT,symptom onset. RT,detection is computed using data from the next 4 days, so even though most people infected on 08/07 were detected late, on 18/07, the RT,detection of 14/07 still reflects this. Third, HCMC continued to have peaks on 22-24/07, i.e., 4-6 days after 18/07. The reason is that the average serial interval T is about 4 days, plus a few days for testing. Every 4 days or so we can observe this effect, but it gets weaker and more diffuse, making it hard to see.
3. The last thing to explain is why detected cases followed the optimistic trajectory in the 4 days 19-22/07, but were worse than the bad scenario in the 3 days 23-25/07. And why, although the last 3 days' cases were so bad, RT still trends downward? We offer three hypotheses.
First hypothesis: Late reporting of cases in some southern provinces caused the trajectory deviation.
Second hypothesis: Contact tracing in HCM is progressing better than before. Note that we have a red curve forecasting new infections (higher than detected cases). The detected cases in the 3 days 23-25/07 being close to the red curve of the optimistic scenario may indicate good tracing.
Third hypothesis: Directive 16 was implemented on 19/07 across the South. As happened with HCMC, people in the provinces may have gone stockpiling, making RT rise about 5-6 days later. From Google Mobility, we see this day was 13/07 (not 18/07 right before distancing). Like HCM, about 10 days later, on 23/07, cases exploded. This happened to coincide with the 2nd round of HCMC's effect above.
Based on the above analysis of the case counts on 18/07 and 22-24/07 in HCMC, we trust the HCMC data. HCMC's case count is also larger than elsewhere. The RT trajectories of VN and HCMC are also very similar. HCMC's RT trajectory falls much faster than VN's. We therefore lean toward a combination of the second and third hypotheses.
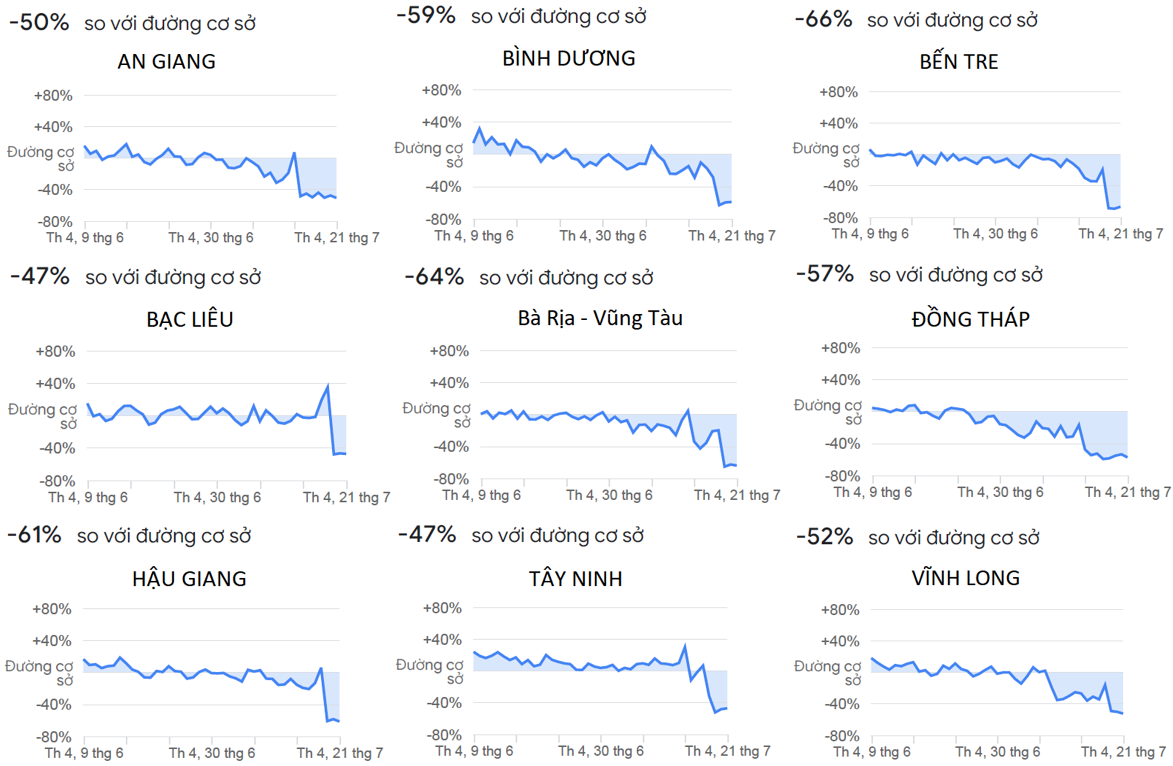
Figure 0b. Google mobility - Supermarkets and pharmacies for 9 southern provinces
4. We add a forecast for HCMC to help predict the number of hospital beds needed. From observing lockdowns in some countries, referencing some models, referencing Bac Giang and Bac Ninh (setting spar to 0.9 to observe the trajectory), and the RT,HCM trajectory (spar = 0.8), we forecast the RT,HCM trajectory for the next 21 days. From that we can forecast daily cases. The results are in Figure 1c and Table 1 below. If the forecast is right, the HCMC epidemic will peak within 2 days. The total cases in the next 21 days is 88,751. If the average hospital stay is 21 days, HCMC needs to prepare about 89k hospital beds. That is a very large number, so HCMC must keep trying even though RT,HCM will fall below 1.
5. For VN, based on the RT,VN trajectory decreasing linearly to above 0.825 over the next 21 days (spar = 0.75), we forecast a total of 102,959 cases in the next 11 days and 196,392 in the next 21 days. The trajectory is slightly worse than last week's optimistic trajectory. The results are in Figure 1 and Table 1.
6. For VN, we cannot rule out the bad scenario now. In the bad scenario where RT is constant (1.41), the total cases in the next 21 days is 292k and keeps rising steeply. The results are in Figure 2 and Table 1.
To conclude, we emphasize that "RT < 1 for 14 consecutive days is when we begin to control the epidemic". For this reason, we keep providing the constant-RT forecast for VN. With Directive 16+ implemented in HCMC and Directive 16 in some places, we hope the future is brighter than the linear trajectory forecast we give. We also hope what happened in the last three days was due to the combined effect of people shopping before the two Directive-16 implementations, rather than the bad scenario. Finally, note that our predicted trajectories are average curves. Real data will be random and fluctuate around the average. If the bad scenario truly happens, we will observe it in the coming days as the optimistic and bad trajectories diverge.
Charts updated 25/07/2021
Figure 1a. Estimates and forecasts for Vietnam (linear-decrease scenario)
Figure 1b. Estimates and forecasts for Vietnam (bad scenario)
Figure 1c. Estimates and forecasts for Ho Chi Minh City

Table 1. Forecast of detected cases in the next 21 days with 2 scenarios for VN and 1 scenario for HCMC
Figure 2. Charts for the provinces/cities. Provinces/cities are ordered first by North - Central - South, then alphabetically.
Figure 3. Charts for the most recent 14 days.
Update 14/07/2021
Below are charts of daily new cases and estimates of the effective reproduction number for Vietnam and the 19 highest-risk provinces/cities. Provinces/cities are ordered first by North – Central – South, then alphabetically. Figure 3 at the bottom is the chart limited to the most recent 14 days. The red curve in the charts is the smoothed RT (smoothing spline with spar 0.5-0.6 in the R language). Some provinces/cities lack enough data for the red curve. Data are from VnExpress. We use the free R programming language for data analysis and charting.
We have some observations on Figure 3. We see RT for Vietnam, Binh Duong, and Ho Chi Minh City (HCM) oscillating around 1.5 with large daily case counts, so these areas are at very high risk (new cases 4 days later are about 1.5 times the new cases 4 days earlier). Dong Nai, Long An, and Tien Giang are all at high risk because RT trends upward (not enough days yet) and case counts are large. Ha Tinh has small data, so its chart is not very meaningful. RT for Vinh Long is large, but the data only span about 2 weeks and the first days' cases were too small, making it hard to predict the current situation.
We can make a rough forecast as follows. If we do not control the epidemic effectively and RT stays above 1.5, the detected cases in the next 4 days (15/7 to 18/7) will be at least 1.5 times the detected cases in the last 4 days (11/7 to 14/7).
Finally, note that because the incubation period is about 4 to 5 days (not much different for the Delta variant), the false-negative probability when newly infected is quite high, and testing and tracing capacity may not be fast enough, the positive cases detected in the next 4 days mostly comprise people already infected 1,2. Therefore, after applying Directive 16, we usually only see its effect after at least 5 days. You can read the slides attached to the previous article for more on the incubation period, the serial interval, and the relationship between them.
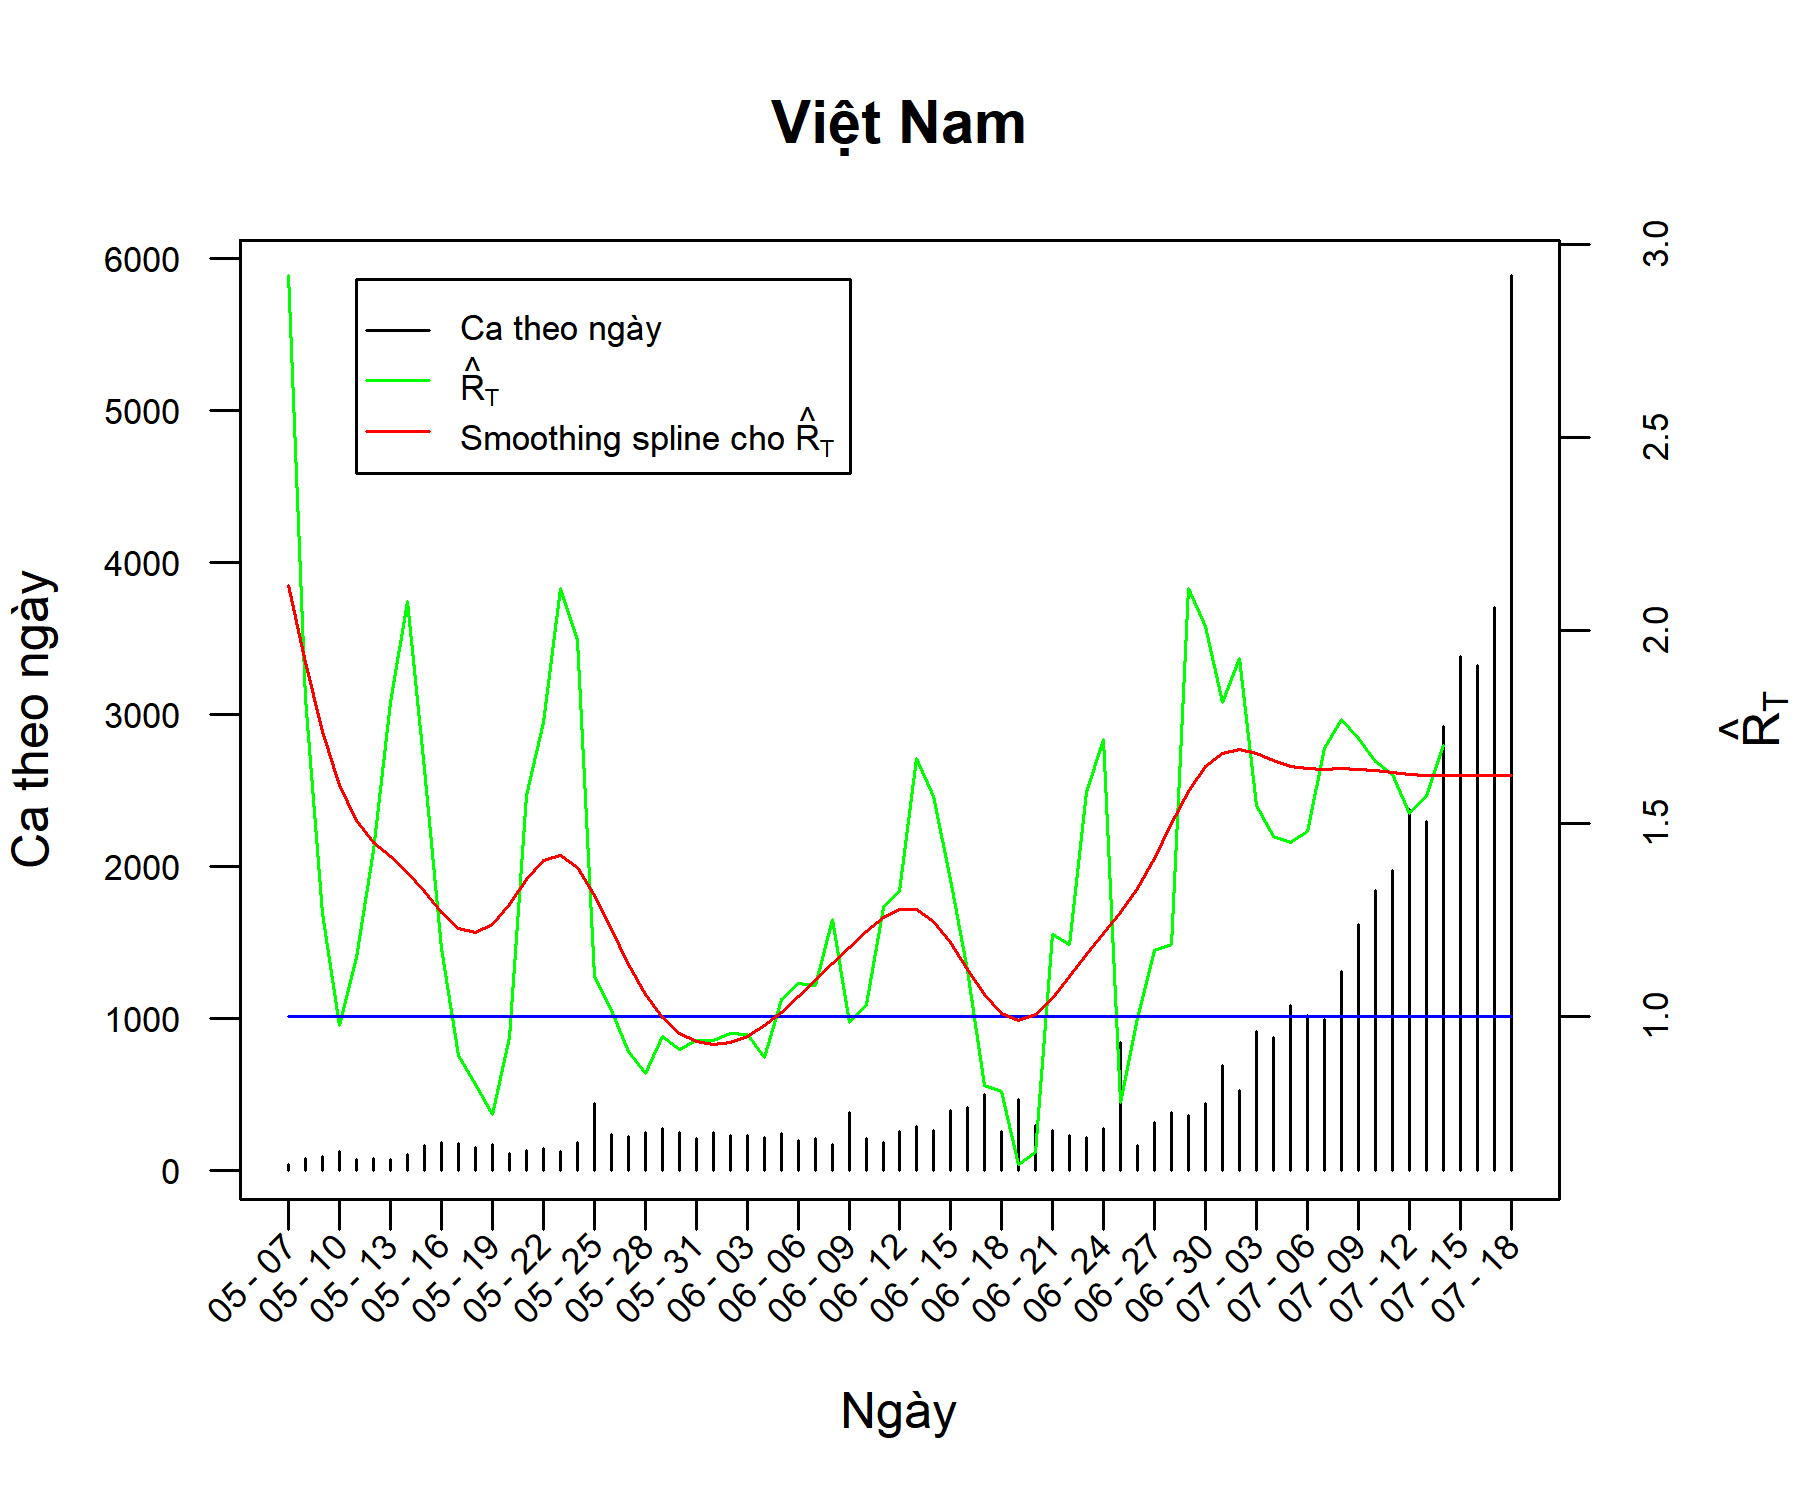
Figure 1. Chart for Vietnam
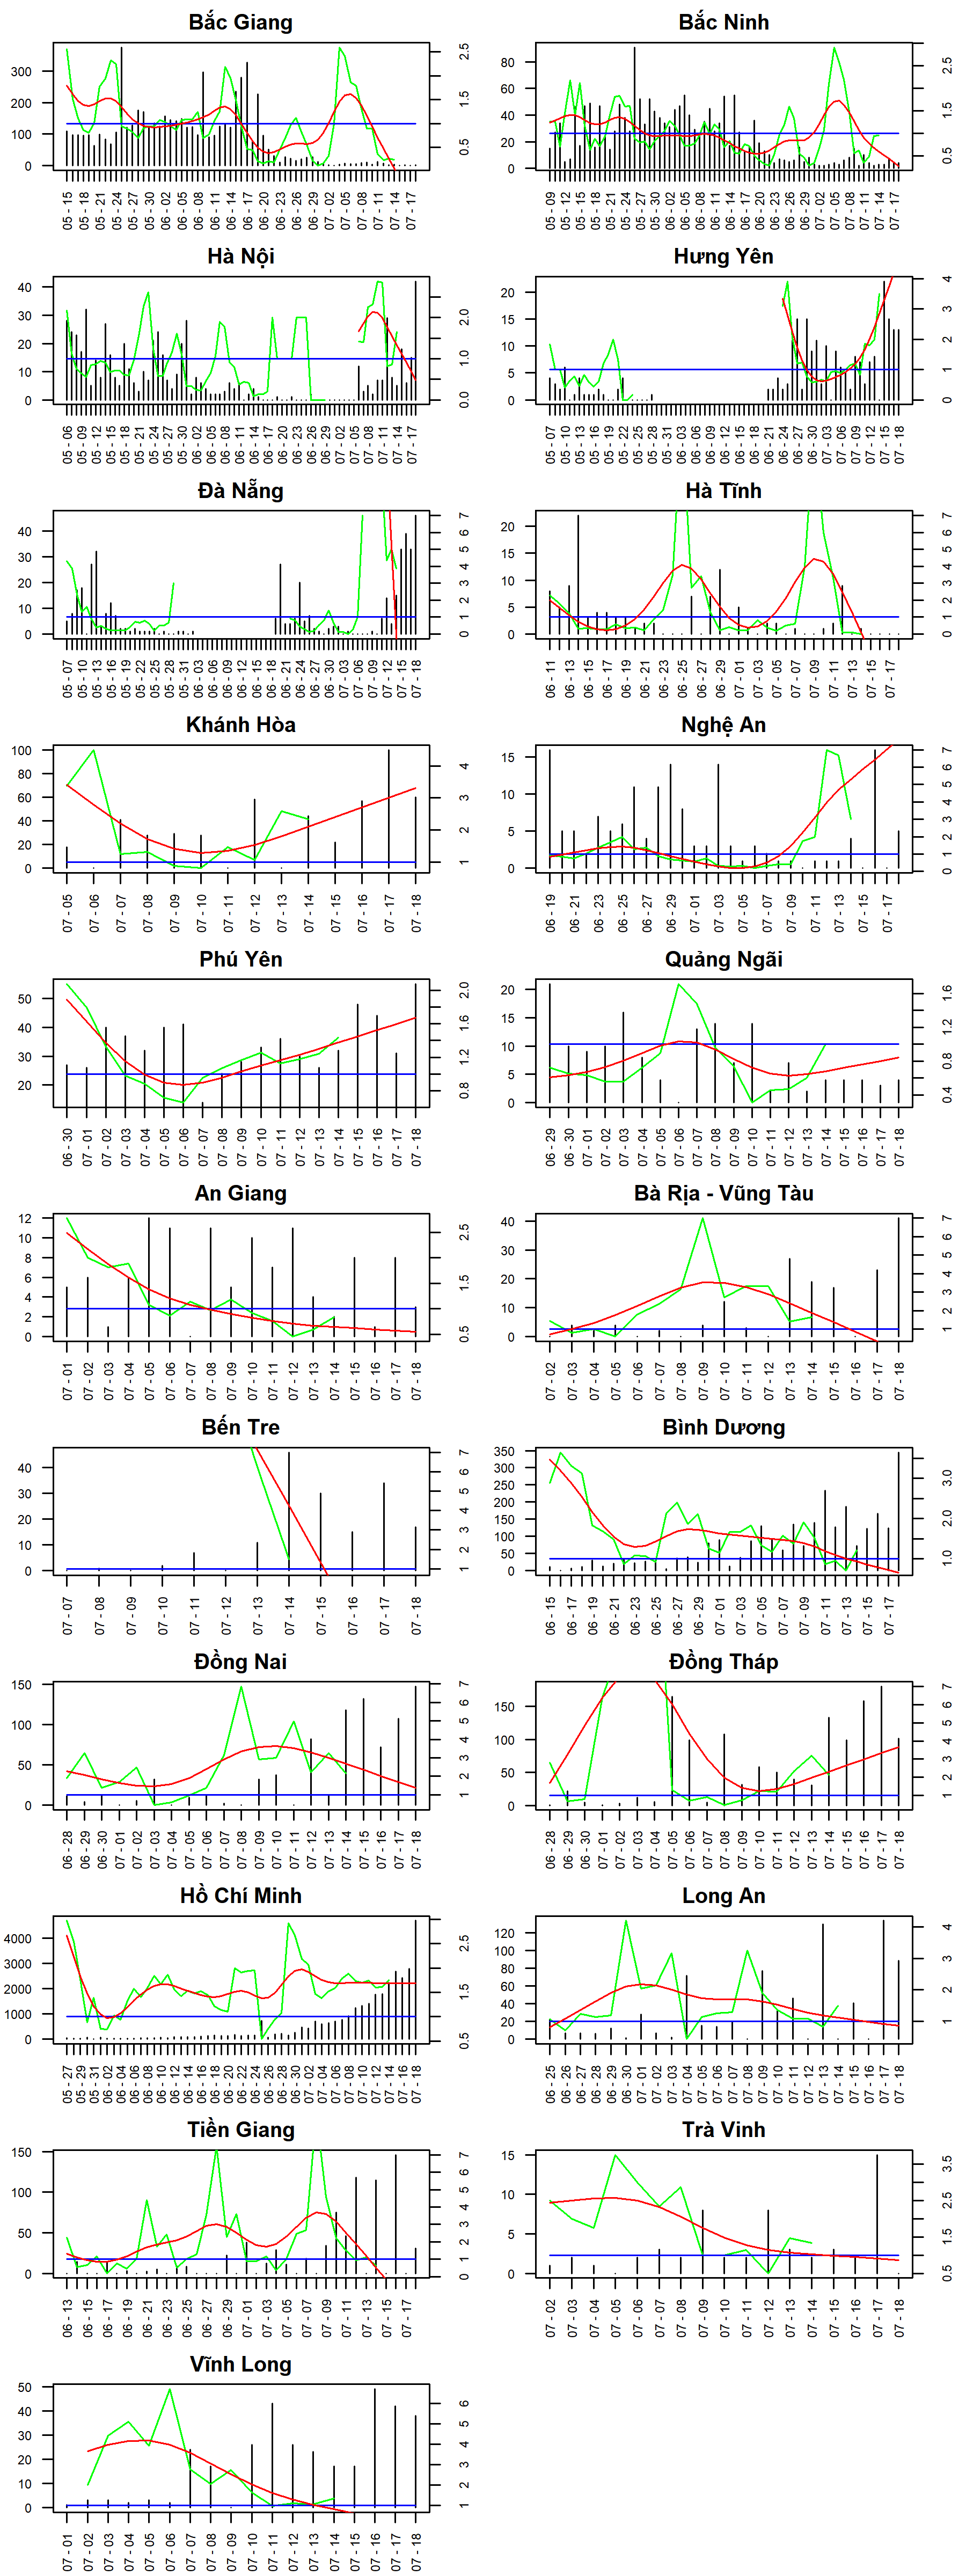
Figure 2. Charts for the provinces/cities. Provinces/cities are ordered first by North – Central – South, then alphabetically.
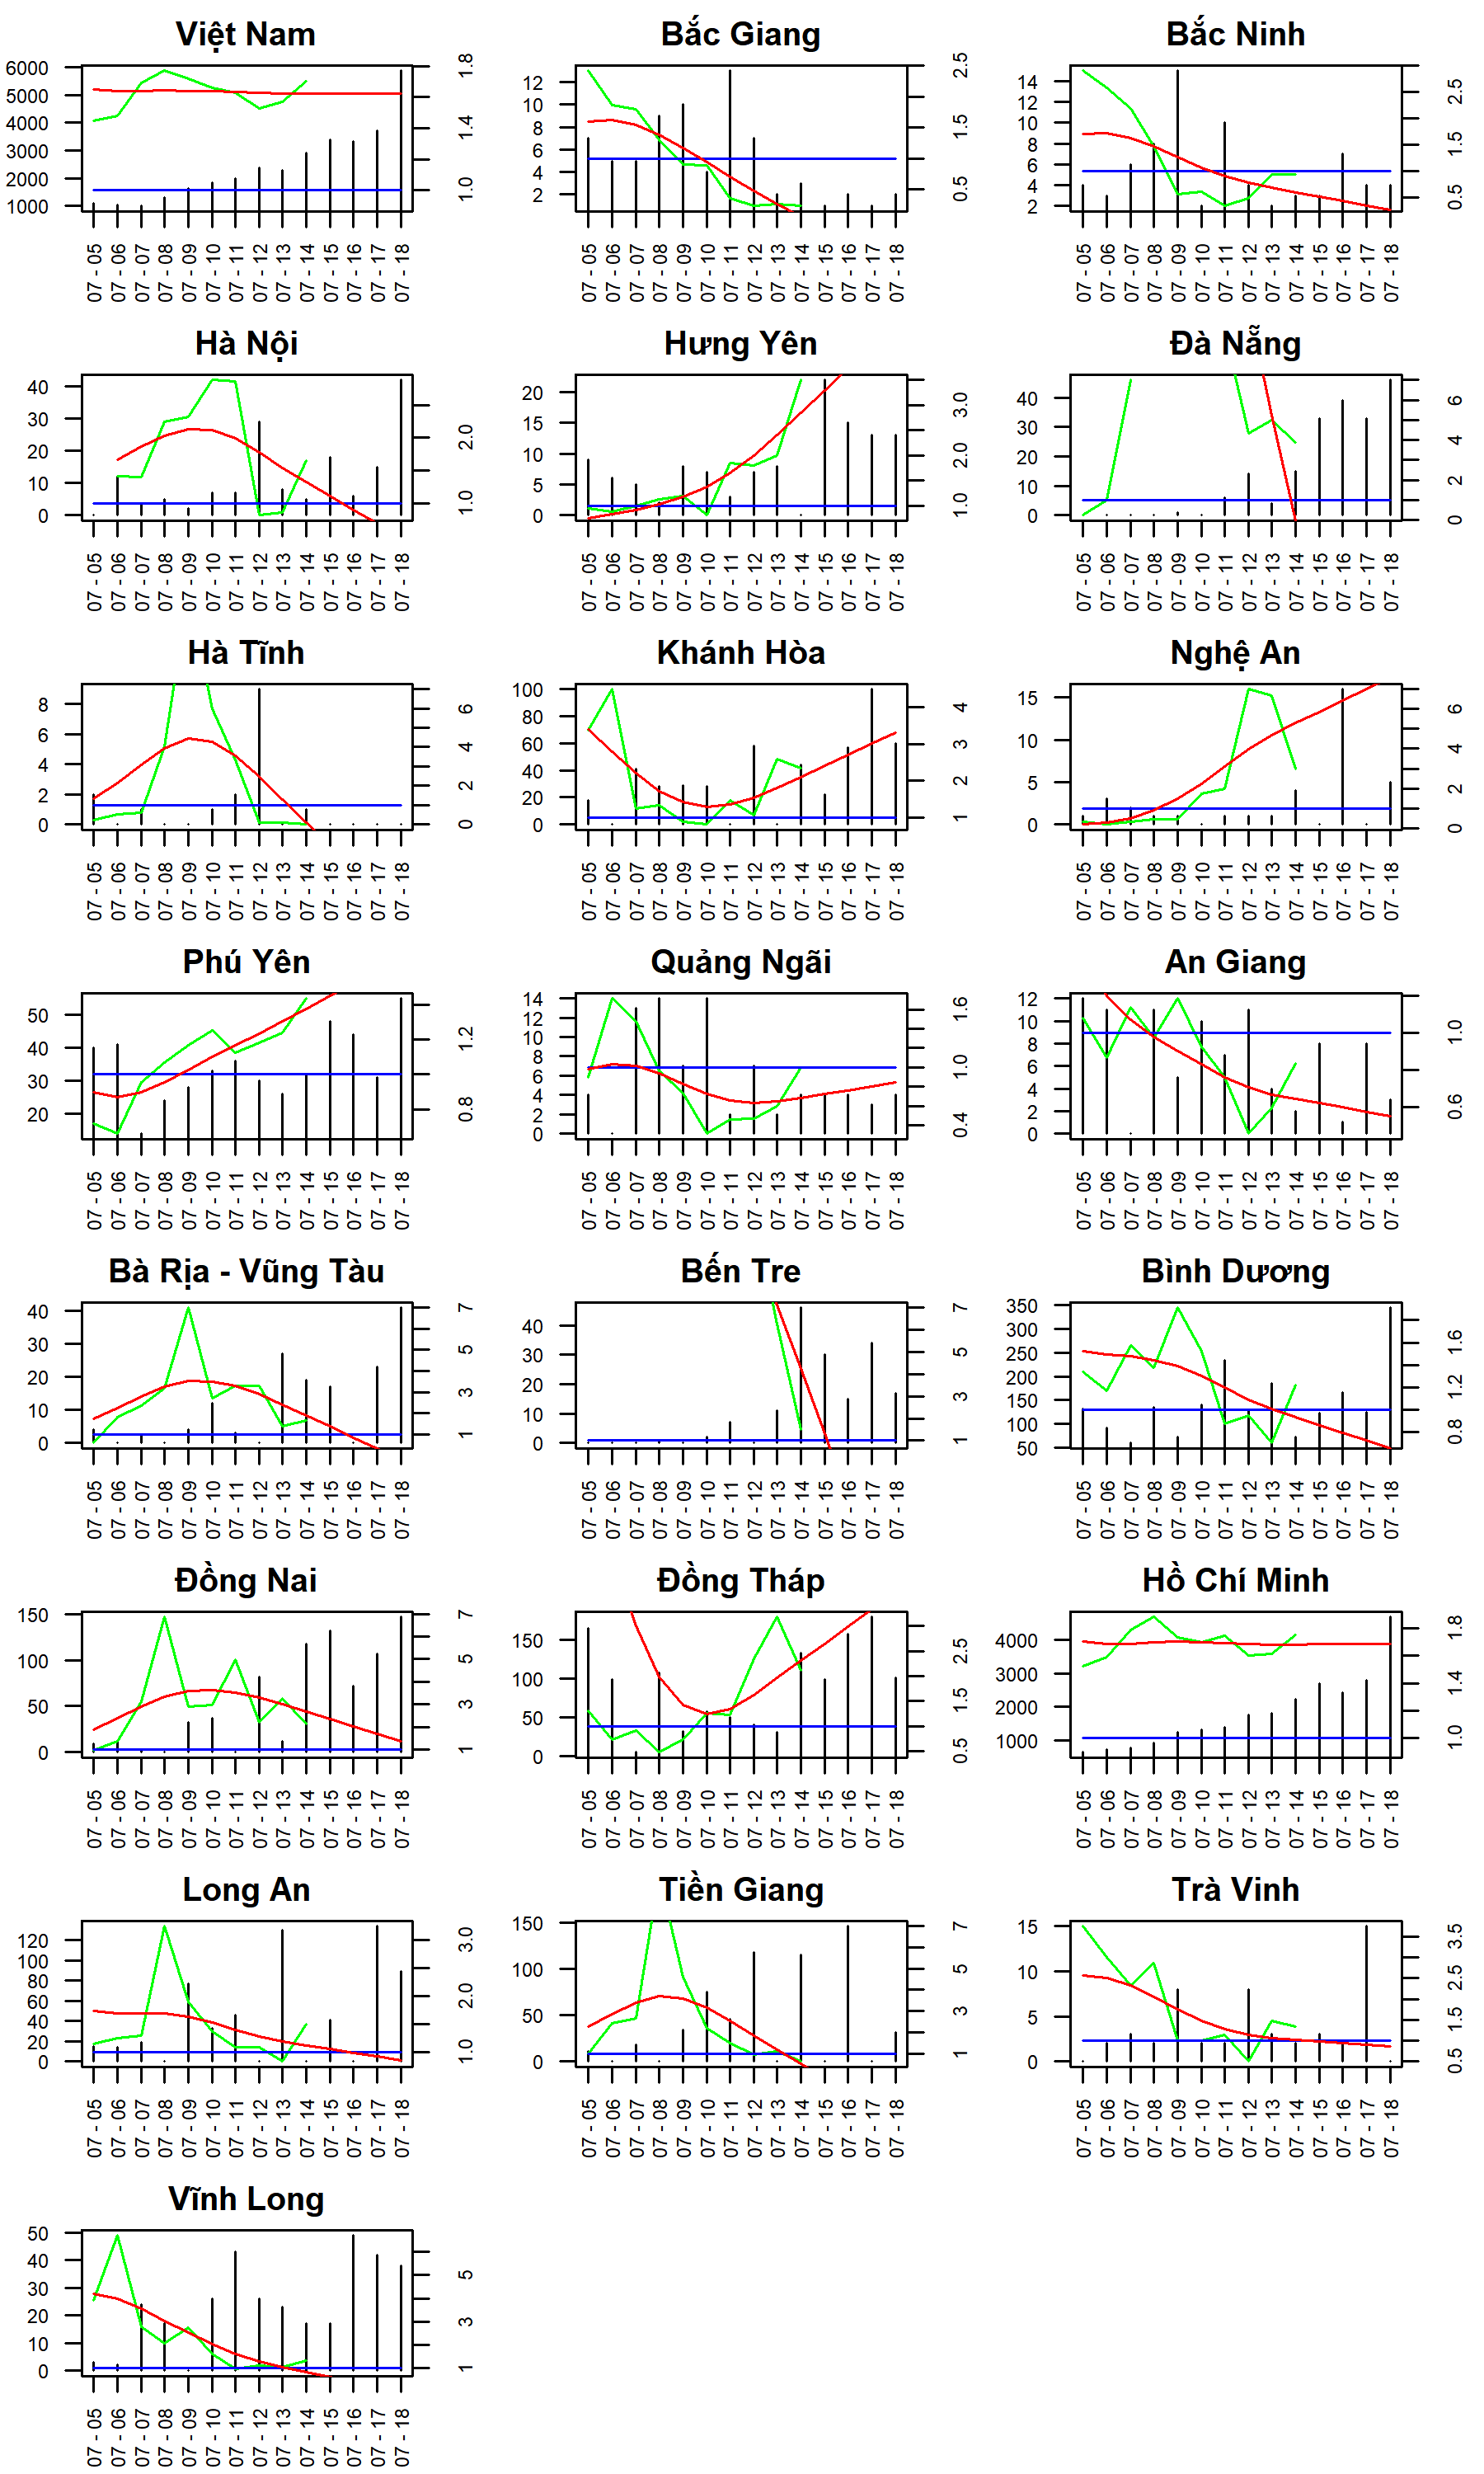
Figure 3. Charts for the most recent 14 days.
References
1. Li, B. et al. Viral infection and transmission in a large well-traced outbreak caused by the Delta SARS-CoV-2 variant. medRxiv 2021.07.07.21260122 (2021). doi:10.1101/2021.07.07.21260122
2. Kucirka, L. M., Lauer, S. A., Laeyendecker, O., Boon, D. & Lessler, J. Variation in False-Negative Rate of Reverse Transcriptase Polymerase Chain Reaction–Based SARS-CoV-2 Tests by Time Since Exposure. Ann. Intern. Med. 173, 262–267 (2020).
- trunght@onyx.vn -
Data source: vnexpress.net